|

WTI Price Analysis: Steps back from 200-HMA as MACD teases bears

  • WTI takes a U-turn from the key SMA to reverse intraday gains.
  • One-week-old horizontal area and a bit broader falling trend line add to the upside barriers.
  • $60.00 can test short-term sellers, further downside can eye the monthly low.

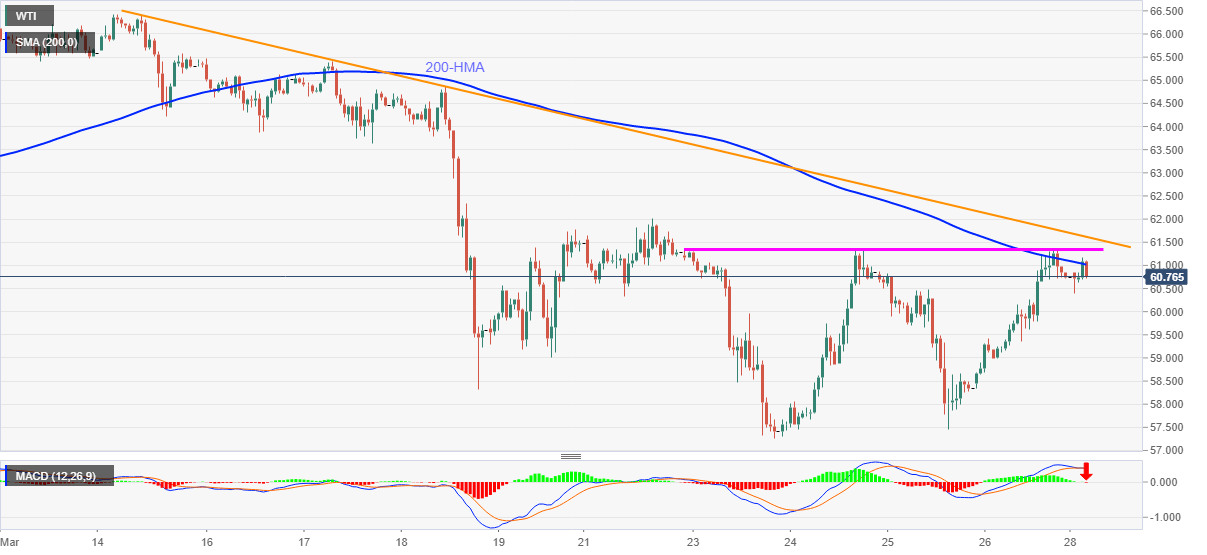
WTI marks another failure in crossing the 200-HMA while easing to $60.78 during early Monday. In doing so, the energy benchmark reverses the early Asian gains as MACD teases bears.

Given the black gold’s repeated failures to cross 200-HMA, not to forget multiple pullbacks from $61.35-30, WTI prices are likely to revisit the $60.00 threshold during the latest weakness.

However, any further downside may not refrain from attacking the $58.60 and $58.00 support levels but the monthly low of $57.27 can challenge the bears afterward.

Alternatively, an upside clearance of 200-HMA, at $61.00, will not only have to cross the stated immediate horizontal area around $61.35-30 but also clear a downward sloping trend line from March 15, at $61.65, to recall the WTI buyers.

Following that, the quote’s run-up to the March 10 low of $63.10 can’t be ruled out.

Overall, WTI battles key resistances and hence sellers should remain cautious even as the MACD flashes bearish signals.

WTI hourly chart

Trend: Pullback expected

Additional important levels

Overview
Today last price60.8
Today Daily Change0.05
Today Daily Change %0.08%
Today daily open60.75
 
Trends
Daily SMA2062.53
Daily SMA5059.15
Daily SMA10052.91
Daily SMA20046.68
 
Levels
Previous Daily High61.35
Previous Daily Low58.33
Previous Weekly High62.02
Previous Weekly Low57.27
Previous Monthly High63.72
Previous Monthly Low51.6
Daily Fibonacci 38.2%60.2
Daily Fibonacci 61.8%59.48
Daily Pivot Point S158.94
Daily Pivot Point S257.12
Daily Pivot Point S355.92
Daily Pivot Point R161.95
Daily Pivot Point R263.16
Daily Pivot Point R364.97

Author

Anil Panchal

Anil Panchal

FXStreet

Anil Panchal has nearly 15 years of experience in tracking financial markets. With a keen interest in macroeconomics, Anil aptly tracks global news/updates and stays well-informed about the global financial moves and their implications.

More from Anil Panchal
Share:

Editor's Picks

AUD/USD falls to near 0.7100 after slipping below 50-day EMA

AUD/USD depreciates after registering minor gains in the previous day, trading around 0.7120 during the Asian hours. The technical analysis of the daily chart shows the pair consolidating sideways within a rectangle pattern, as neither bulls nor bears gain control. The AUD/USD pair is holding a slight bearish tone however as it sits beneath both the nine-day and 50-day EMAs.

160.00: USD/JPY back near intervention territory after upbeat US jobs report

US Nonfarm Payrolls beat expectations by a wide margin in May, with 172K jobs added. The US Dollar rebounds after the release, helping USD/JPY recover from its intraday lows. Warnings from Japanese authorities continue to limit upside potential near the 160.00 threshold.

Gold weakens to three-month lows near $4,300

Gold faces increasing selling interest and approaches the area of three-month lows near the $4,300 mark per troy ounce on Friday. The precious metal’s decline comes as traders assess the stronger-than-expected NFP, while the bid bias in the Greenback and higher US Treasury yields also collaborate with the retracement.

Cardano hits five-year low even as Hoskinson clarifies "break" isn't an exit

Cardano (ADA) price is down 10% at press time on Friday, extending losses over 30% so far this week amid Charles Hoskinson's clarification that "break" isn't an exit.

Week ahead – Fed countdown begins amid US inflation data and geopolitical risks

Fed Chair Warsh’s first meeting approaches as key US inflation data could reshape expectations. Oil prices remain elevated as US-Iran talks continue; tariffs also return to the spotlight. ECB is expected to hike; will it be a one-off move or is July live?

The US economy defies the rules: 100 days into the Oil shock and the recession signal is still missing

More than three months after the start of the Iran war and the resulting disruption to global energy markets, the US economy continues to display remarkable resilience. The conflict has triggered a sharp rise in Oil prices, reignited inflationary pressures and fueled widespread concerns about a potential economic slowdown.