|

WTI Price Analysis: On its way to test key $64 support area

  • WTI sellers remain alive and kicking as inflation fears roil markets.
  • The US oil pressured by Colonial Pipeline restart news, ignores EIA data.
  • Hourly chart shows a test of the key support near $64 appears inevitable.

WTI (futures on NYMEX) is extending its correction from weekly highs of $66.62, down nearly 2.5% on the day, as the $64 mark remains at risk.

At the time of writing, WTI is testing lows around $64.40, weighed down by the news that the Colonial pipeline is likely to restart its operations. Meanwhile, the turmoil in the global equities, courtesy of mounting inflation concerns, exerts additional pressure on the higher-yielding oil.

Meanwhile, markets shrug off a drawdown in the Energy Information Administration’s (EIA) weekly US crude stockpiles and a sharp drop in the exports.

From a near-term technical perspective, the risks remain tilted to the downside after the price pieced through the critical 100 and 200-simple moving average (SMA) on hourly sticks.

The sell-off intensified on a break below the aforesaid support levels, which coincide at $65.15, opening floors for a test of static support at $63.90.

WTI one-hour chart

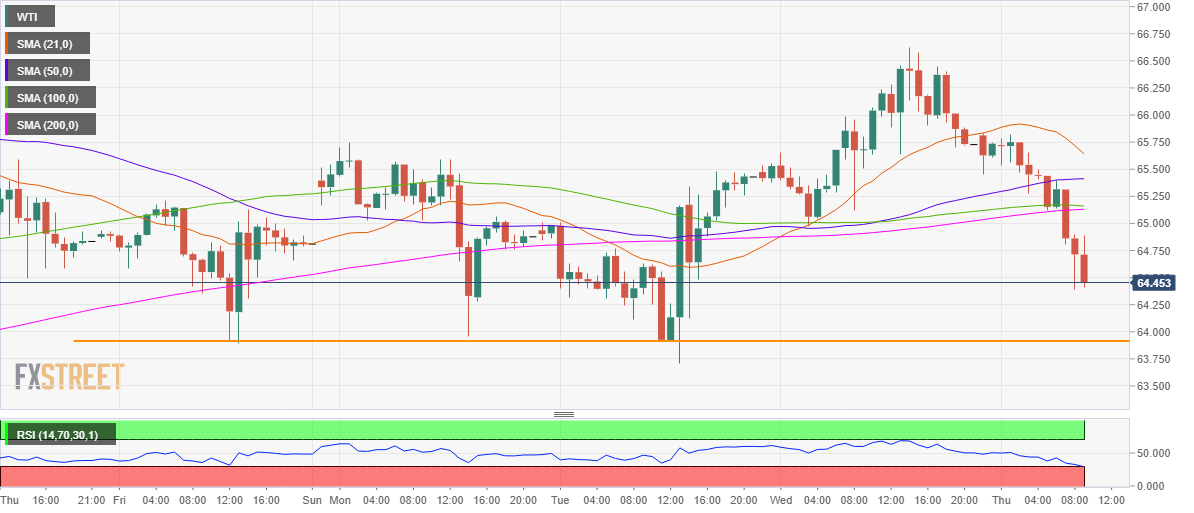
The bulls, however, could manage to defend that downside cap, as the Relative Strength Index (RSI) has entered into the oversold territory.

Any pullbacks could test the $65.15 support now resistance, above which the 50-SMA at $65.42 could be put to test.

Further up, the bearish 21-SMA at $65.64 could threaten the recovery.

WTI additional levels

WTI

Overview
Today last price64.50
Today Daily Change-1.23
Today Daily Change %-1.87
Today daily open65.73
 
Trends
Daily SMA2063.77
Daily SMA5062.57
Daily SMA10058.56
Daily SMA20050.18
 
Levels
Previous Daily High66.63
Previous Daily Low64.97
Previous Weekly High66.7
Previous Weekly Low62.88
Previous Monthly High65.4
Previous Monthly Low57.66
Daily Fibonacci 38.2%66
Daily Fibonacci 61.8%65.61
Daily Pivot Point S164.93
Daily Pivot Point S264.13
Daily Pivot Point S363.28
Daily Pivot Point R166.58
Daily Pivot Point R267.43
Daily Pivot Point R368.23

Author

Dhwani Mehta

Dhwani Mehta

FXStreet

Residing in Mumbai (India), Dhwani is a Senior Analyst and Manager of the Asian session at FXStreet. She has over 10 years of experience in analyzing and covering the global financial markets, with specialization in Forex and commodities markets.

More from Dhwani Mehta
Share:

Markets move fast. We move first.

Orange Juice Newsletter brings you expert driven insights - not headlines. Every day on your inbox.

By subscribing you agree to our Terms and conditions.

Editor's Picks

EUR/USD climbs toward 1.1800 on broad USD weakness

EUR/USD gathers bullish momentum and advances toward 1.1800 in the second half of the day on Tuesday. The US Dollar weakens and helps the pair stretch higher after the employment report showed that Nonfarm Payrolls declined by 105,000 in October before rising by 64,000 in November.

GBP/USD climbs to fresh two-month high above 1.3400

GBP/USD gains traction in the American session and trades at its highest level since mid-October above 1.3430. The British Pound benefits from upbeat PMI data, while the US Dollar struggles to find demand following the mixed employment figures and weaker-than-forecast PMI prints, allowing the pair to march north.

Gold recovers above $4,300 as markets react to weak US data

Gold trades in positive above $4,300 after spending the first half of the day under bearish pressure. XAU/USD capitalizes on renewed USD weakness after the jobs report showed that the Unemployment Rate climbed to 4.6% in November and the PMI data revealed a loss of growth momentum in the private sector in December. 

US Retail Sales virtually unchanged at $732.6 billion in October

Retail Sales in the United States were virtually unchanged at $732.6 billion in October, the US Census Bureau reported on Tuesday. This print followed the 0.1% increase (revised from 0.3%) recorded in September and came in below the market expectation of +0.1%.

Ukraine-Russia in the spotlight once again

Since the start of the week, gold’s price has moved lower, but has yet to erase the gains made last week. In today’s report we intend to focus on the newest round of peace talks between Russia and Ukraine, whilst noting the release of the US Employment data later on day and end our report with an update in regards to the tensions brewing in Venezuela.

BNB Price Forecast: BNB slips below $855 as bearish on-chain signals and momentum indicators turn negative

BNB, formerly known as Binance Coin, continues to trade down around $855 at the time of writing on Tuesday, after a slight decline the previous day. Bearish sentiment further strengthens as BNB’s on-chain and derivatives data show rising retail activity.