|

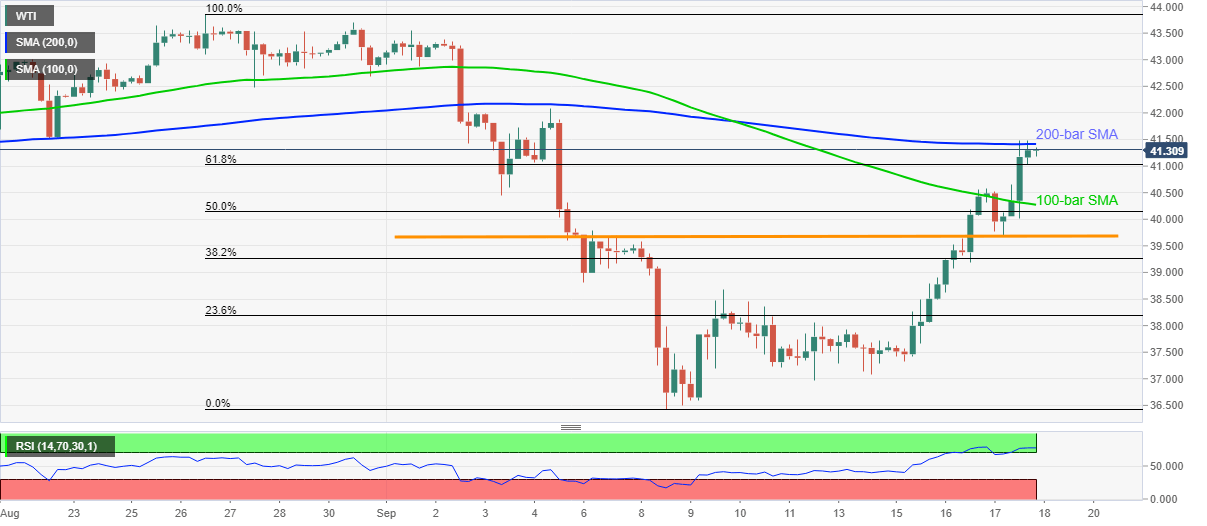
WTI Price Analysis: 200-bar SMA guards immediate upside beyond $41.00

  • WTI fizzles the run-up above $40.00 after flashing two-week high of $41.48.
  • Overbought RSI conditions, strong SMA probe the bulls.
  • Sellers await a clear downside break of 61.8% Fibonacci retracement level around the $41.00 area.

WTI consolidates the recent gains to $41.48 within a choppy range above $41.00, currently up 0.20% around $41.30, during the early Friday morning in Asia. The black gold surged to the highest since September 04 the previous day after breaking 100-bar SMA. Though, the 200-bar SMA seems to restrict the commodity’s latest up-moves amid overbought RSI conditions.

Considering the strength of the 200-bar SMA and signals of a pullback marked by the RSI, sellers remain hopeful. The same push them to look for entry if oil prices drop below the 61.8% Fibonacci retracement level of August 26 to September 08 downside, near $41.00.

In doing so, WTI will become vulnerable to revisit the 100-bar SMA level of $40.27 before catching a breather around the $40.00 threshold.

It should, however, be noted that a nine-day-old horizontal support linear $39.70 may question the energy bears after $40.00.

Meanwhile, an upside clearance of $41.42 figures, comprising 200-bar SMA, will aim for September 04 top of $42.07 before the August 27 bottom near $42.50 challenge further rise.

In a case where the WTI bulls dominate past-$42.50, August month’s top, also the highest since March 05, surrounding $43.85, will be in the spotlight.

WTI four-hour chart

Trend: Pullback expected

Additional important levels

Overview
Today last price41.27
Today Daily Change0.86
Today Daily Change %2.13%
Today daily open40.41
 
Trends
Daily SMA2040.79
Daily SMA5041.22
Daily SMA10037.83
Daily SMA20041.11
 
Levels
Previous Daily High40.58
Previous Daily Low38.61
Previous Weekly High39.78
Previous Weekly Low36.43
Previous Monthly High43.86
Previous Monthly Low39.75
Daily Fibonacci 38.2%39.82
Daily Fibonacci 61.8%39.36
Daily Pivot Point S139.15
Daily Pivot Point S237.9
Daily Pivot Point S337.18
Daily Pivot Point R141.12
Daily Pivot Point R241.83
Daily Pivot Point R343.09

Author

Anil Panchal

Anil Panchal

FXStreet

Anil Panchal has nearly 15 years of experience in tracking financial markets. With a keen interest in macroeconomics, Anil aptly tracks global news/updates and stays well-informed about the global financial moves and their implications.

More from Anil Panchal
Share:

Markets move fast. We move first.

Orange Juice Newsletter brings you expert driven insights - not headlines. Every day on your inbox.

By subscribing you agree to our Terms and conditions.

Editor's Picks

EUR/USD ticks lower following the release of FOMC Minutes

The US Dollar found some near-term demand following the release of the FOMC meeting minutes, with the EUR/USD pair currently piercing the 1.1750 threshold. The document showed officials are still willing to trim interest rates. Meanwhile, thinned holiday trading keeps major pairs confined to familiar levels.

GBP/USD remains sub- 1.3500, remains in the red

The GBP/USD lost traction early in the American session, maintaining the sour tone and trading around 1.3460 following the release of the FOMC meeting minutes. Trading conditions remain thin ahead of the New Year holiday, limiting the pair's volatility.

Gold stable above $4,350 as the year comes to an end

Gold price got to recover some modest ground on Tuesday, holding on to intraday gains and changing hands at $4,360 a troy ounce in the American afternoon. The bright metal showed no reaction to the release of the FOMC December meeting minutes.

Ethereum: ETH holds above $2,900 despite rising selling activity

Ethereum (ETH) held the $2,900 level despite seeing increased selling pressure over the past week. The Exchange Netflow metric showed deposits outweighed withdrawals by about 400K ETH. The high value suggests rising selling activity amid the holiday season.

Economic outlook 2026-2027 in advanced countries: Solidity test

After a year marked by global economic resilience and ending on a note of optimism, 2026 looks promising and could be a year of solid economic performance. In our baseline scenario, we expect most of the supportive factors at work in 2025 to continue to play a role in 2026.

Crypto market outlook for 2026

Year 2025 was volatile, as crypto often is.  Among positive catalysts were favourable regulatory changes in the U.S., rise of Digital Asset Treasuries (DAT), adoption of AI and tokenization of Real-World-Assets (RWA).