WTI Crude Oil posts largest weekly drop since March 2023
- WTI Crude Oil reports the largest weekly loss since March 2023.
- OPEC prepares to increase supply by an additional 411,000 barrels per day in July, easing supply concerns
- WTI remains supported by the $64.00 psychological level, but easing tensions in the Middle East limit near-term gains.

West Texas Intermediate (WTI) Crude Oil has fallen sharply since reaching a high of $76.44 on Monday, with prices declining more than $10.00 per barrel this week.
With losses over the past five sessions rising above 12%, this marks the largest weekly decline since March 2023.
At the time of writing, WTI trades below $65.00 per barrel, with prices pressured by profit-taking and a significant shift in geopolitical sentiment.
Israel-Iran ceasefire holds as OPEC prepares to increase supply in July
Concerns about a potential supply disruption in the Strait of Hormuz drove the rally that had pushed WTI near $77.00. However, with tensions in the Middle East easing and the Israel-Iran ceasefire holding, those concerns have largely abated.
According to a Reuters report citing Goldman Sachs options data, the market now assigns just a 4% probability of a supply disruption, leading traders to price WTI within a more stable $60–$69 range for the coming months.
Fundamentally, while the Energy Information Administration (EIA) reported a larger-than-expected decline in US inventories on Wednesday, the impact of this data has been limited.
The Organization of the Petroleum Exporting Countries (OPEC) is expected to increase production by an additional 411,000 barrels per day in July. As a result, traders remain cautious about chasing prices higher, particularly in a macro environment where demand signals remain mixed.
WTI Crude Oil: Technical outlook
From a technical perspective, WTI has found support near the 38.2% Fibonacci retracement of the January–April decline at $64.18.
Immediate support now rests at the $64.00 psychological level, with a move lower opening the potential for a retest of the 50-day Simple Moving Average (SMA) at $63.35.
As long as supply concerns remain subdued, upside momentum appears limited, with the 100-day SMA providing short-term resistance around $65.45.
WTI Crude Oil daily chart
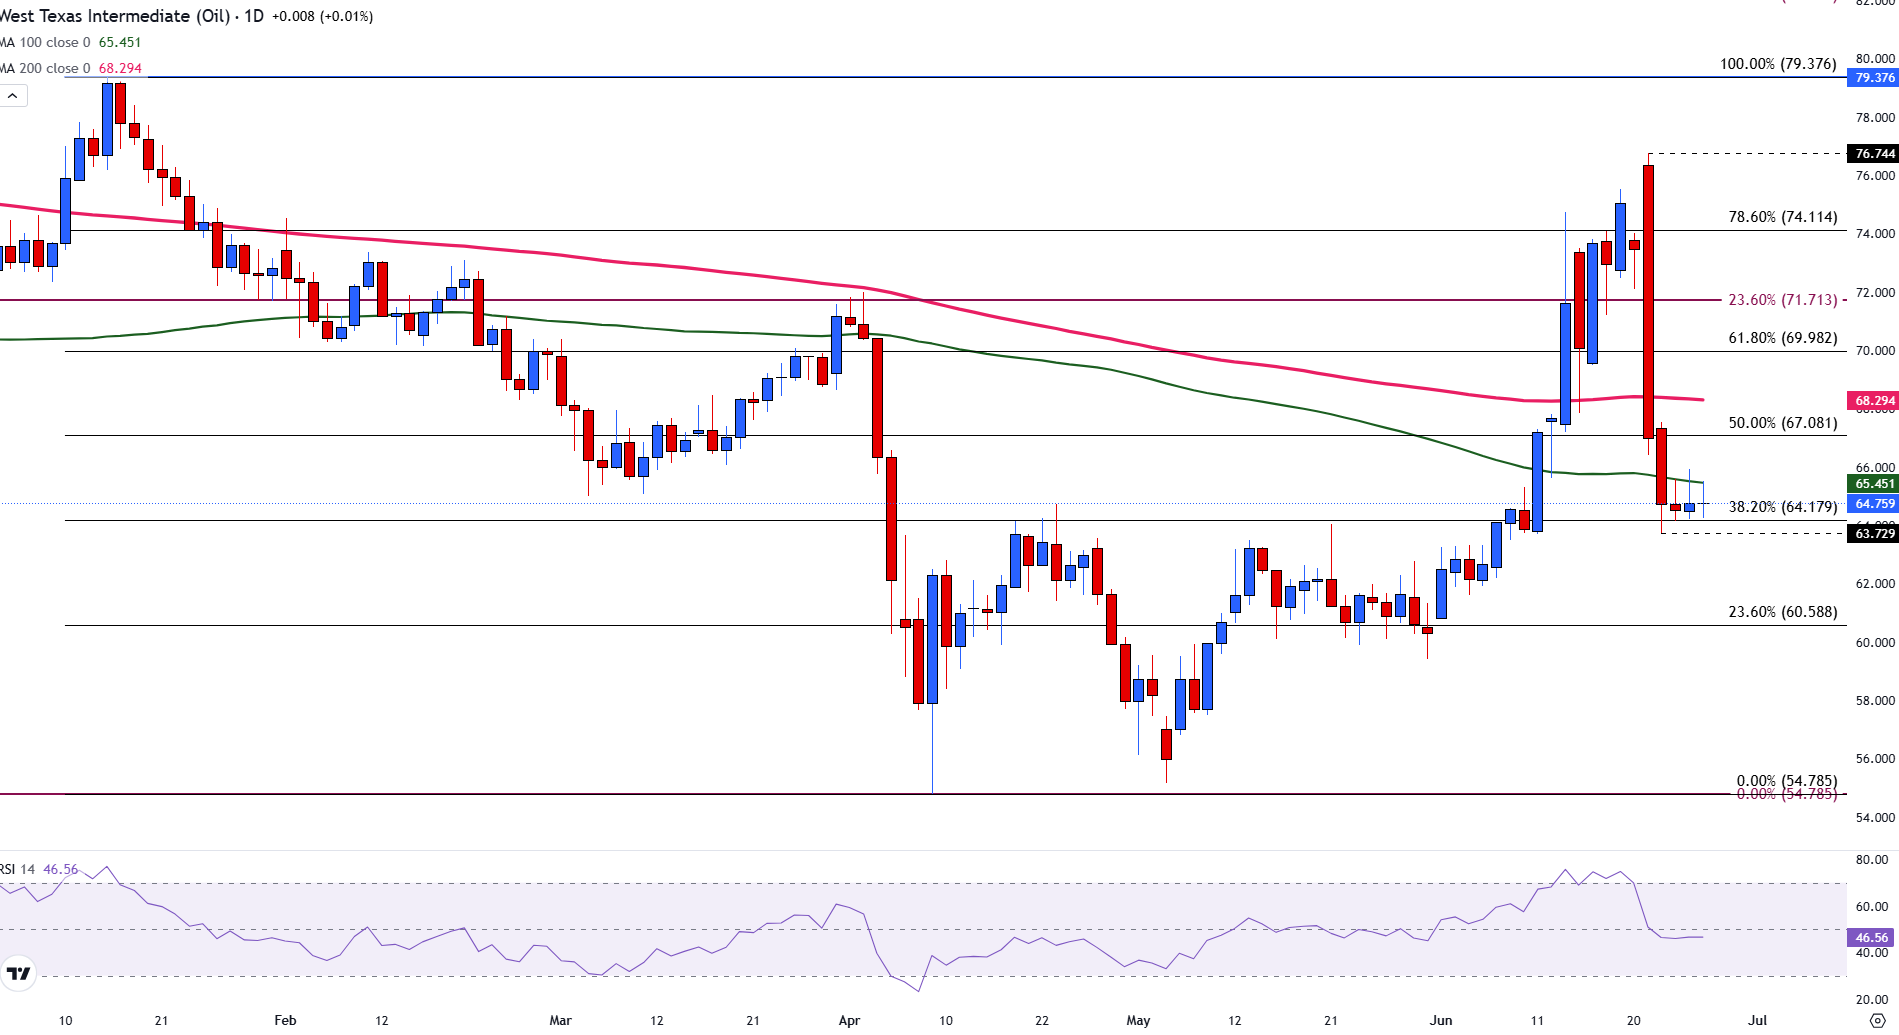
Above that sits the 50% retracement at $67.08, followed by the 200-day SMA at $68.29.
The Relative Strength Index (RSI) is tracking just below the neutral 50 mark, currently at 46, signaling a slight bearish bias.
WTI Oil FAQs
WTI Oil is a type of Crude Oil sold on international markets. The WTI stands for West Texas Intermediate, one of three major types including Brent and Dubai Crude. WTI is also referred to as “light” and “sweet” because of its relatively low gravity and sulfur content respectively. It is considered a high quality Oil that is easily refined. It is sourced in the United States and distributed via the Cushing hub, which is considered “The Pipeline Crossroads of the World”. It is a benchmark for the Oil market and WTI price is frequently quoted in the media.
Like all assets, supply and demand are the key drivers of WTI Oil price. As such, global growth can be a driver of increased demand and vice versa for weak global growth. Political instability, wars, and sanctions can disrupt supply and impact prices. The decisions of OPEC, a group of major Oil-producing countries, is another key driver of price. The value of the US Dollar influences the price of WTI Crude Oil, since Oil is predominantly traded in US Dollars, thus a weaker US Dollar can make Oil more affordable and vice versa.
The weekly Oil inventory reports published by the American Petroleum Institute (API) and the Energy Information Agency (EIA) impact the price of WTI Oil. Changes in inventories reflect fluctuating supply and demand. If the data shows a drop in inventories it can indicate increased demand, pushing up Oil price. Higher inventories can reflect increased supply, pushing down prices. API’s report is published every Tuesday and EIA’s the day after. Their results are usually similar, falling within 1% of each other 75% of the time. The EIA data is considered more reliable, since it is a government agency.
OPEC (Organization of the Petroleum Exporting Countries) is a group of 12 Oil-producing nations who collectively decide production quotas for member countries at twice-yearly meetings. Their decisions often impact WTI Oil prices. When OPEC decides to lower quotas, it can tighten supply, pushing up Oil prices. When OPEC increases production, it has the opposite effect. OPEC+ refers to an expanded group that includes ten extra non-OPEC members, the most notable of which is Russia.
Author

Tammy Da Costa, CFTe®
FXStreet
Tammy is an economist and market analyst with a deep passion for financial markets, particularly commodities and geopolitics.


