Visa Inc. (V) Elliott Wave technical analysis [Video]
![Visa Inc. (V) Elliott Wave technical analysis [Video]](https://editorial.fxsstatic.com/images/i/cpi-dataphone-card_XtraLarge.png)
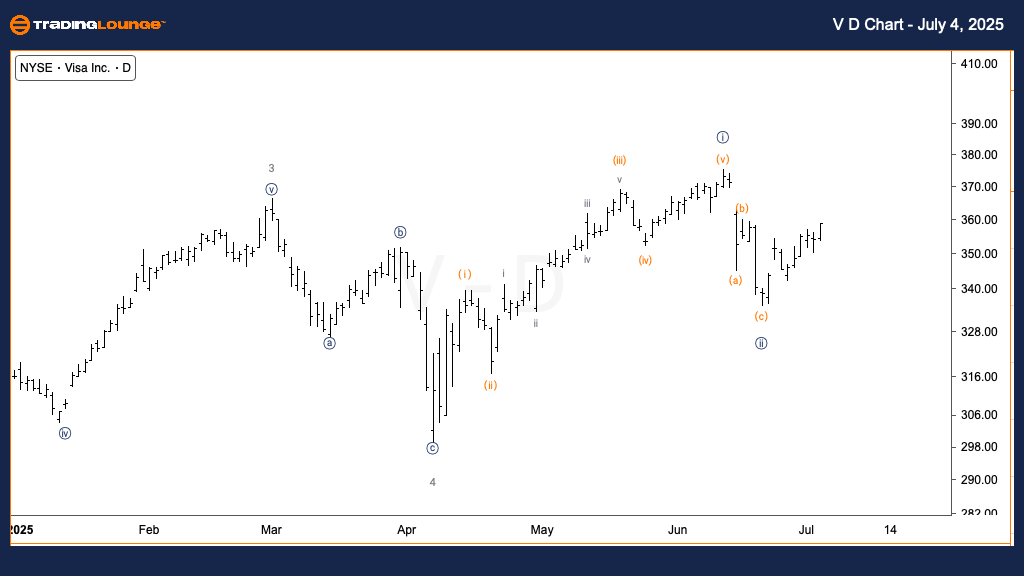
Visa Inc. (V) Elliott Wave technical analysis – Daily chart
-
Function: Trend.
-
Mode: Motive.
-
Structure: Impulsive.
-
Position: Wave {iii} of 5.
-
Direction: Upward in wave {iii}.
-
Details: Bullish alternative favors further upside into wave {iii}, as price action extends into wave 5.
Visa Inc. (V) is displaying a bullish trend setup on the daily chart. The current wave structure indicates an advancing wave {iii} of 5, within a larger impulsive sequence. This analysis supports the view that price is extending higher in wave 5, suggesting the beginning of a strong upside phase. If confirmed, this wave count indicates renewed buying momentum and a strengthening bullish structure in the final leg of this cycle.
Visa Inc. (V) Elliott Wave technical analysis – One-hour chart
-
Function: Trend.
-
Mode: Motive.
-
Structure: Impulsive.
-
Position: Wave (iii) of {iii}.
-
Direction: Upward in wave (iii).
-
Details: Current movement may be a subdivision of wave {iii}, assuming wave {ii} has bottomed. Alternate view: wave (b) of {ii} still developing.
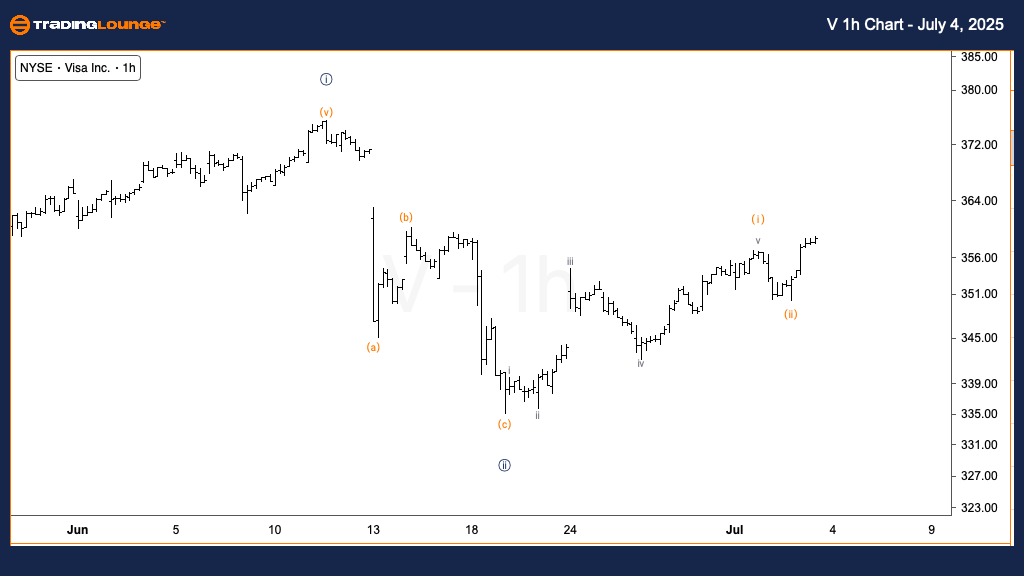
On the 1-hour chart, the structure is forming wave (iii) of {iii}, suggesting that a new impulsive move is underway. The bullish count assumes wave {ii} is complete, setting the stage for further gains in wave (iii). However, an alternative scenario indicates the possibility of the price still being within wave (b) of {ii}. Confirmation through sustained upward movement will be key to validating the bullish forecast and confirming the next phase in Visa’s Elliott Wave cycle.
Visa Inc. (V) Elliott Wave technical analysis [Video]
Author

Peter Mathers
TradingLounge
Peter Mathers started actively trading in 1982. He began his career at Hoei and Shoin, a Japanese futures trading company.


