USDCAD Price Analysis: Further downside towards 1.3350 seems plausible


  • USDCAD remains pressured at the lowest levels in seven weeks.
  • Weekly resistance line, bearish MACD signals keep sellers hopeful.
  • A convergence of 61.8% Fibonacci retracement, mid-September swing high lures bears.
  • Previous support line from early October, 200-SMA also challenge buyers.

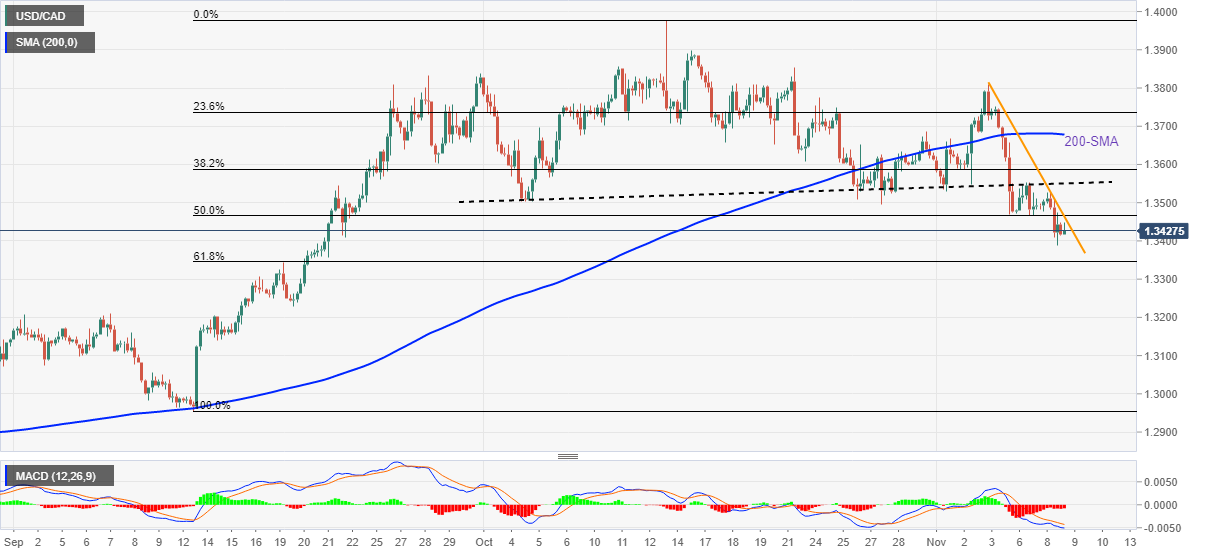
USDCAD seesaws around the intraday low as bears take a breather near the seven-week bottom marked the previous day. That said, the Loonie pair makes rounds to 1.3430 during early Wednesday.

A one-week-old descending trend line portrays the quote’s recent weakness. Also keeping the sellers hopeful are the bearish MACD signal and the clear break of the previous support line from early October. Additionally, the pair’s sustained trading below the 200-SMA also adds strength to the downside bias.

Hence, the USDCAD is all set to refresh the multi-day low marked the previous day around 1.3385.

In doing so, a convergence of the 61.8% Fibonacci retracement level of the pair’s September-October upside and the September 19 swing high, close to 1.3350-45, gains the bear’s attention.

Following that, the early September peak around 1.3200 should return to the charts.

Alternatively, recovery moves need to cross a joint of the weekly resistance line and the 50% Fibonacci retracement level, surrounding 1.3450, to recall the USDCAD buyers.

Even so, the support-turned-resistance around 1.3550 and the 200-SMA near 1.3680 could challenge the pair’s further upside.

USDCAD: Four-hour chart

Trend: Further downside expected

Additional important levels

Overview
Today last price 1.3428
Today Daily Change -0.0005
Today Daily Change % -0.04%
Today daily open 1.3433
 
Trends
Daily SMA20 1.3661
Daily SMA50 1.3511
Daily SMA100 1.3216
Daily SMA200 1.2969
 
Levels
Previous Daily High 1.3527
Previous Daily Low 1.3387
Previous Weekly High 1.3808
Previous Weekly Low 1.3469
Previous Monthly High 1.3978
Previous Monthly Low 1.3496
Daily Fibonacci 38.2% 1.3441
Daily Fibonacci 61.8% 1.3474
Daily Pivot Point S1 1.3371
Daily Pivot Point S2 1.331
Daily Pivot Point S3 1.3232
Daily Pivot Point R1 1.3511
Daily Pivot Point R2 1.3589
Daily Pivot Point R3 1.365


Share: Feed news

Information on these pages contains forward-looking statements that involve risks and uncertainties. Markets and instruments profiled on this page are for informational purposes only and should not in any way come across as a recommendation to buy or sell in these assets. You should do your own thorough research before making any investment decisions. FXStreet does not in any way guarantee that this information is free from mistakes, errors, or material misstatements. It also does not guarantee that this information is of a timely nature. Investing in Open Markets involves a great deal of risk, including the loss of all or a portion of your investment, as well as emotional distress. All risks, losses and costs associated with investing, including total loss of principal, are your responsibility. The views and opinions expressed in this article are those of the authors and do not necessarily reflect the official policy or position of FXStreet nor its advertisers. The author will not be held responsible for information that is found at the end of links posted on this page.

If not otherwise explicitly mentioned in the body of the article, at the time of writing, the author has no position in any stock mentioned in this article and no business relationship with any company mentioned. The author has not received compensation for writing this article, other than from FXStreet.

FXStreet and the author do not provide personalized recommendations. The author makes no representations as to the accuracy, completeness, or suitability of this information. FXStreet and the author will not be liable for any errors, omissions or any losses, injuries or damages arising from this information and its display or use. Errors and omissions excepted.

The author and FXStreet are not registered investment advisors and nothing in this article is intended to be investment advice.

Recommended content


Recommended content

Editors’ Picks

EUR/USD clings to daily gains above 1.0650

EUR/USD clings to daily gains above 1.0650

EUR/USD gained traction and turned positive on the day above 1.0650. The improvement seen in risk mood following the earlier flight to safety weighs on the US Dollar ahead of the weekend and helps the pair push higher.

EUR/USD News

GBP/USD recovers toward 1.2450 after UK Retail Sales data

GBP/USD recovers toward 1.2450 after UK Retail Sales data

GBP/USD reversed its direction and advanced to the 1.2450 area after touching a fresh multi-month low below 1.2400 in the Asian session. The positive shift seen in risk mood on easing fears over a deepening Iran-Israel conflict supports the pair.

GBP/USD News

Gold holds steady at around $2,380 following earlier spike

Gold holds steady at around $2,380 following earlier spike

Gold stabilized near $2,380 after spiking above $2,400 with the immediate reaction to reports of Israel striking Iran. Meanwhile, the pullback seen in the US Treasury bond yields helps XAU/USD hold its ground.

Gold News

Bitcoin Weekly Forecast: BTC post-halving rally could be partially priced in Premium

Bitcoin Weekly Forecast: BTC post-halving rally could be partially priced in

Bitcoin price shows no signs of directional bias while it holds above  $60,000. The fourth BTC halving is partially priced in, according to Deutsche Bank’s research. 

Read more

Week ahead – US GDP and BoJ decision on top of next week’s agenda

Week ahead – US GDP and BoJ decision on top of next week’s agenda

US GDP, core PCE and PMIs the next tests for the Dollar. Investors await BoJ for guidance about next rate hike. EU and UK PMIs, as well as Australian CPIs also on tap.

Read more

Forex MAJORS

Cryptocurrencies

Signatures