USD/TRY Price Analysis: Multiple Dojis signal Turkish lira seller’s indecision above 21-DMA
- USD/TRY stays sluggish for the third consecutive day.
- 21-DMA, bullish MACD signals keep buyers hopeful but previous support line restricts immediate upside.
- Candlestick formation hints at pair buyers’ struggle amid lackluster markets.
USD/TRY carries the previous two-day indecision, treads water around $13.80 during early Tuesday.
Even so, the Turkish lira (TRY) manages to defend the 21-DMA breakout, backed by bullish MACD signals.
It should, however, be noted that the recent Doji candlesticks join the pair’s downside break of a 13-day-old ascending trend line to keep sellers hopeful.
Though, a sustained trading below the 21-DMA level of $13.30 becomes necessary for the pair to retest the monthly low near $12.75, a break of which will direct USD/TRY bears towards December’s bottom surrounding $10.25.
Meanwhile, recovery moves remain elusive below the previous support line, around $14.60 at the latest.
Following that, a run-up towards December’s high, also the all-time top of $18.36, can’t be ruled out.
USD/TRY: Daily chart
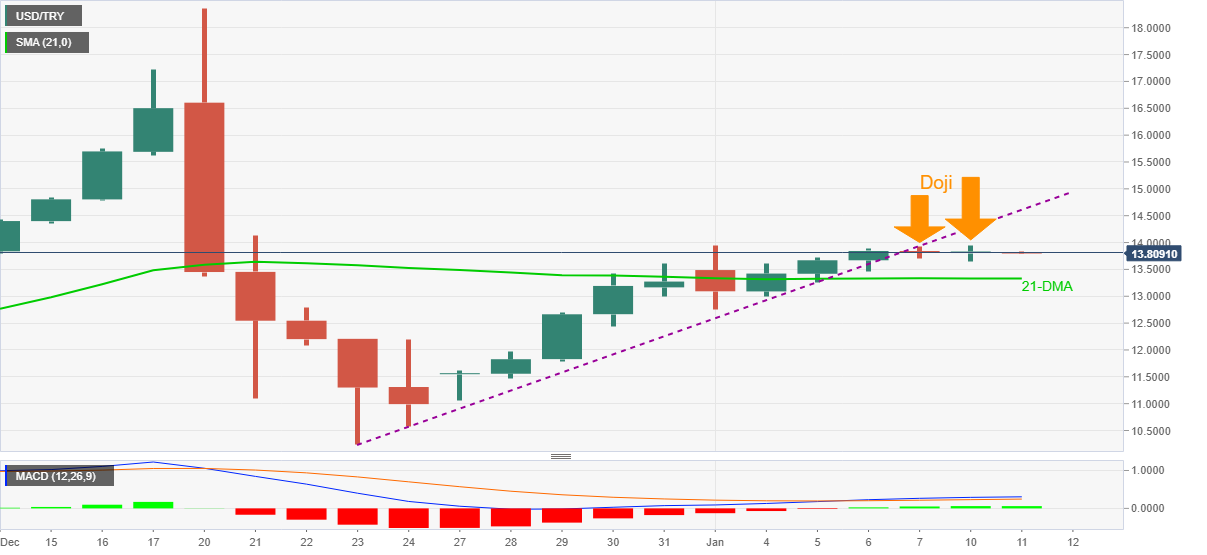
Trend: Sideways
Author

Anil Panchal
FXStreet
Anil Panchal has nearly 15 years of experience in tracking financial markets. With a keen interest in macroeconomics, Anil aptly tracks global news/updates and stays well-informed about the global financial moves and their implications.


