USD/MXN Price Analysis: Mexican Peso sellers take a breather below 18.00 resistance


  • USD/MXN snaps five-day uptrend by printing mild losses at two-week high.
  • Upbeat oscillators, sustained break of 21-DMA favor Mexican Peso sellers.
  • Seven-week-old descending trend line guards immediate upside ahead of the key DMAs.

USD/MXN bulls ease control after a five-day uptrend as the Mexican Peso (MXN) pair retreats from a 13-day-high to 17.89 amid early Tuesday.

Even so, the USD/MXN buyers remain hopeful amid a successful break of the 21-DMA, around 17.80 by the press time. Adding strength to the upside bias for the pair are the bullish MACD signals and the firmer RSI (14) line.

As a result, the USD/MXN bulls keep the reins despite the latest retreat. However, the buyers need conviction from a downward-sloping resistance line from early April, close to 18.00, to convince the pair buyers.

Following that, the 50-DMA and 100-DMA, respectively near 18.10 and 18.35, could test the USD/MXN bulls before giving them control. Above all, a downward-sloping resistance line from  December 2022, close to 18.75 at the latest, becomes the key hurdle for the pair to cross to aim for the highs marked in March and February, close to 19.25 and 19.30.

On the flip side, a daily closing below the 21-DMA support of 17.80 could recall the Mexican Peso buyers who target 17.50 support.

Should the USD/MXN remains bearish past 17.50, the yearly low marked during mid-May around 17.40 can act as the last defense of the Mexican Peso sellers.

USD/MXN: Daily chart

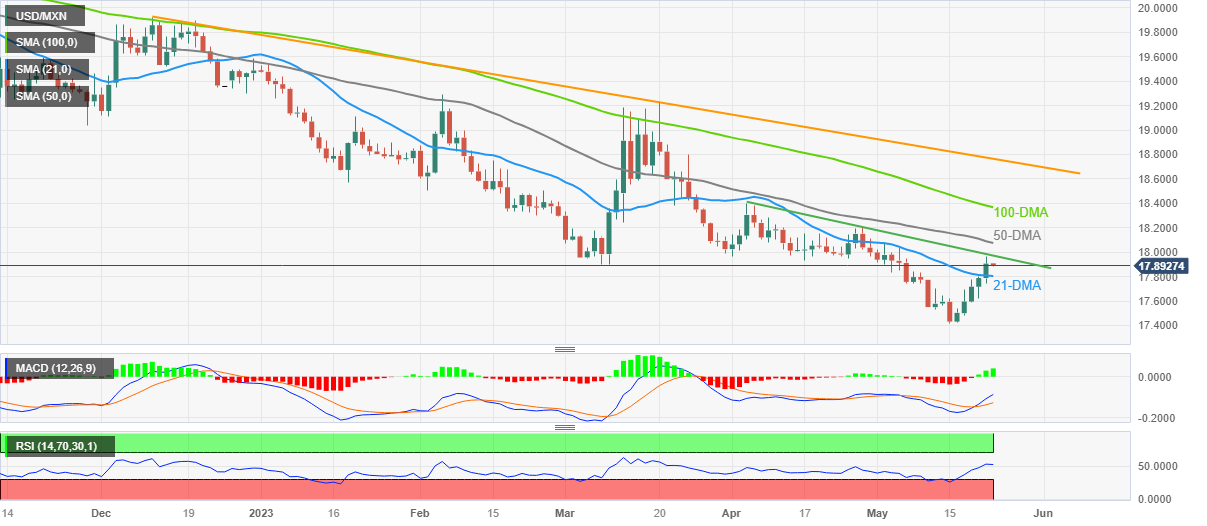
Trend: Further upside expected

Additional important levels

Overview
Today last price 17.888
Today Daily Change -0.0184
Today Daily Change % -0.10%
Today daily open 17.9064
 
Trends
Daily SMA20 17.8006
Daily SMA50 18.0894
Daily SMA100 18.3822
Daily SMA200 19.0896
 
Levels
Previous Daily High 17.9608
Previous Daily Low 17.7462
Previous Weekly High 17.7978
Previous Weekly Low 17.4203
Previous Monthly High 18.4018
Previous Monthly Low 17.9329
Daily Fibonacci 38.2% 17.8789
Daily Fibonacci 61.8% 17.8282
Daily Pivot Point S1 17.7814
Daily Pivot Point S2 17.6565
Daily Pivot Point S3 17.5668
Daily Pivot Point R1 17.9961
Daily Pivot Point R2 18.0858
Daily Pivot Point R3 18.2107


Share: Feed news

Information on these pages contains forward-looking statements that involve risks and uncertainties. Markets and instruments profiled on this page are for informational purposes only and should not in any way come across as a recommendation to buy or sell in these assets. You should do your own thorough research before making any investment decisions. FXStreet does not in any way guarantee that this information is free from mistakes, errors, or material misstatements. It also does not guarantee that this information is of a timely nature. Investing in Open Markets involves a great deal of risk, including the loss of all or a portion of your investment, as well as emotional distress. All risks, losses and costs associated with investing, including total loss of principal, are your responsibility. The views and opinions expressed in this article are those of the authors and do not necessarily reflect the official policy or position of FXStreet nor its advertisers. The author will not be held responsible for information that is found at the end of links posted on this page.

If not otherwise explicitly mentioned in the body of the article, at the time of writing, the author has no position in any stock mentioned in this article and no business relationship with any company mentioned. The author has not received compensation for writing this article, other than from FXStreet.

FXStreet and the author do not provide personalized recommendations. The author makes no representations as to the accuracy, completeness, or suitability of this information. FXStreet and the author will not be liable for any errors, omissions or any losses, injuries or damages arising from this information and its display or use. Errors and omissions excepted.

The author and FXStreet are not registered investment advisors and nothing in this article is intended to be investment advice.

Recommended content


Recommended content

Editors’ Picks

EUR/USD holds above 1.0650 after US data

EUR/USD holds above 1.0650 after US data

EUR/USD retreats from session highs but manages to hold above 1.0650 in the early American session. Upbeat macroeconomic data releases from the US helps the US Dollar find a foothold and limits the pair's upside.

EUR/USD News

GBP/USD retreats toward 1.2450 on modest USD rebound

GBP/USD retreats toward 1.2450 on modest USD rebound

GBP/USD edges lower in the second half of the day and trades at around 1.2450. Better-than-expected Jobless Claims and Philadelphia Fed Manufacturing Index data from the US provides a support to the USD and forces the pair to stay on the back foot.

GBP/USD News

Gold clings to strong daily gains above $2,380

Gold clings to strong daily gains above $2,380

Gold trades in positive territory above $2,380 on Thursday. Although the benchmark 10-year US Treasury bond yield holds steady following upbeat US data, XAU/USD continues to stretch higher on growing fears over a deepening conflict in the Middle East.

Gold News

Ripple faces significant correction as former SEC litigator says lawsuit could make it to Supreme Court

Ripple faces significant correction as former SEC litigator says lawsuit could make it to Supreme Court

Ripple (XRP) price hovers below the key $0.50 level on Thursday after failing at another attempt to break and close above the resistance for the fourth day in a row. 

Read more

Have we seen the extent of the Fed rate repricing?

Have we seen the extent of the Fed rate repricing?

Markets have been mostly consolidating recent moves into Thursday. We’ve seen some profit taking on Dollar longs and renewed demand for US equities into the dip. Whether or not this holds up is a completely different story.

Read more

Forex MAJORS

Cryptocurrencies

Signatures