|

USD/MXN Price Analysis: Hovers near 18.0700 aligned with the barrier at seven-day EMA

  • USD/MXN rebounds after a losing streak.
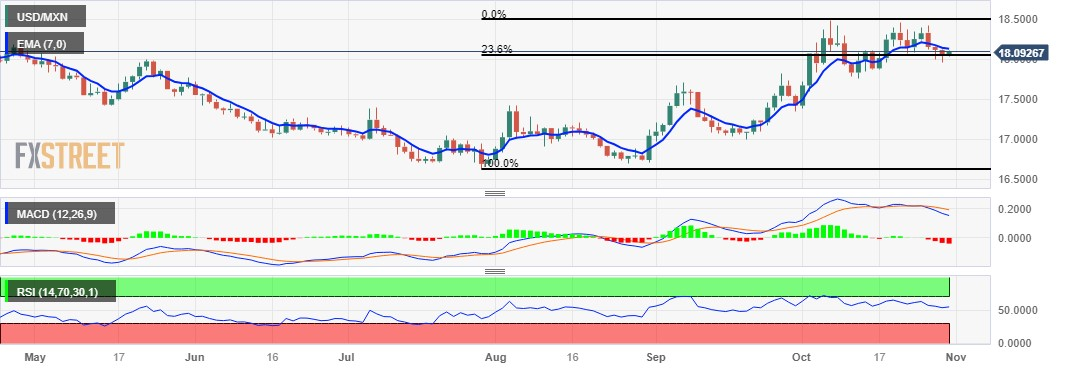
  • MACD line diverges below the signal line, indicating that upward momentum weakens.
  • Support at 23.6% Fibonacci retracement aligned with the 18.0000 key level.

USD/MXN snaps a three-day losing streak, trading higher around 18.0700 during the Asian session on Tuesday, followed by the key resistance around the seven-day Exponential Moving Average (EMA) at 18.1310 lined up with the key level at 18.2000.

A firm breakthrough above the barrier could open the doors for the USD/MXN pair to explore the region around the previous week’s low at 18.4257 in sync with the monthly low at 18.4945.

On the downside, the USD/MXN pair could receive support around the 23.6% Fibonacci retracement at 18.0526 lined up with the 18.0000 major level, followed by the weekly high at 17.9749.

The Moving Average Convergence Divergence (MACD) line remains above the centerline but diverges below the signal line, suggesting a potential shift in momentum. This divergence indicates that the recent upward momentum may be slowing down.

The 14-day Relative Strength Index (RSI) lies above the 50 level, indicating a bullish momentum in the market. This suggests that the recent gains in the USD/MXN pair have been stronger and the pair is overbought, implying strength in the current trend.

USD/MXN: Daily Chart

USD/MXN: More Technical levels

Overview
Today last price18.0766
Today Daily Change0.0274
Today Daily Change %0.15
Today daily open18.0492
 
Trends
Daily SMA2018.1151
Daily SMA5017.5651
Daily SMA10017.2941
Daily SMA20017.7302
 
Levels
Previous Daily High18.141
Previous Daily Low17.9653
Previous Weekly High18.4247
Previous Weekly Low18.0002
Previous Monthly High17.8174
Previous Monthly Low16.9727
Daily Fibonacci 38.2%18.0324
Daily Fibonacci 61.8%18.0739
Daily Pivot Point S117.9627
Daily Pivot Point S217.8762
Daily Pivot Point S317.7871
Daily Pivot Point R118.1384
Daily Pivot Point R218.2275
Daily Pivot Point R318.314

Author

Akhtar Faruqui

Akhtar Faruqui is a Forex Analyst based in New Delhi, India. With a keen eye for market trends and a passion for dissecting complex financial dynamics, he is dedicated to delivering accurate and insightful Forex news and analysis.

More from Akhtar Faruqui
Share:

Editor's Picks

EUR/USD holds losses below 1.1650 on renewed USD uptick

EUR/USD is off the low but remains in the red below 1.1650 in European trading on Thursday. The pair faces headwinds from a renewed uptick in the US Dollar amid a negative shift in risk sentiment. Surging energy prices due to the Middle East war keep the bearish pressure intact on the Euro. The US Jobless Claims data are next of note. 

GBP/USD underperforms as UK faces stagflation risks amid Middle East war

The Pound Sterling trades lower against its major currency peers, is down 0.22% around 1.3340 against the US Dollar, during the Asian trade on Thursday. The British currency faces selling pressures amid fears that the United Kingdom economy could face stagflation risks due to higher energy prices, a situation in which inflation accelerates with economic growth and employment conditions remaining stagnant.

Gold climbs near $5,200 as Iran war fuels safe-haven demand

Gold price extends its gains for the second successive session on Thursday as traders seek safety amid the ongoing war in the Middle East. US and Israeli strikes across Iranian territory and widespread Iranian missile and drone retaliation across the Middle East, including attacks on regional targets and military sites, prolong the crisis and its impact.

Top Crypto Gainers: Decred, Zcash, and Dogecoin lead recovery as Bitcoin crosses $72,000

Bitcoin trades above $72,500 at press time on Thursday, holding its 6% gain from the previous day, contributing to a broader market recovery. The total cryptocurrency market capitalization stands at over $2.43 trillion as the broader market sentiment improves significantly.

First Venezuela, now Iran: The US-China energy war escalates

At first glance, the latest escalation involving the United States with both Iran and Venezuela looks like another chapter in a long-running geopolitical story. But viewed through a broader strategic lens, something else may be unfolding: Energy.

Cardano Price Analysis: Approaches key trendline amid bearish sentiment

Cardano (ADA) price is approaching its descending trendline around $0.28 at the time of writing, set to shape the next directional move. The derivatives metrics paint a bearish picture, with ADA’s Open Interest continuing to fall and short bets rising among traders.