USD/JPY Technical Analysis: USD/JPY supported above 111.00 level
- USD/JPY is in its fourth day of consolidation after the currency pair broke to the upside on July 31.
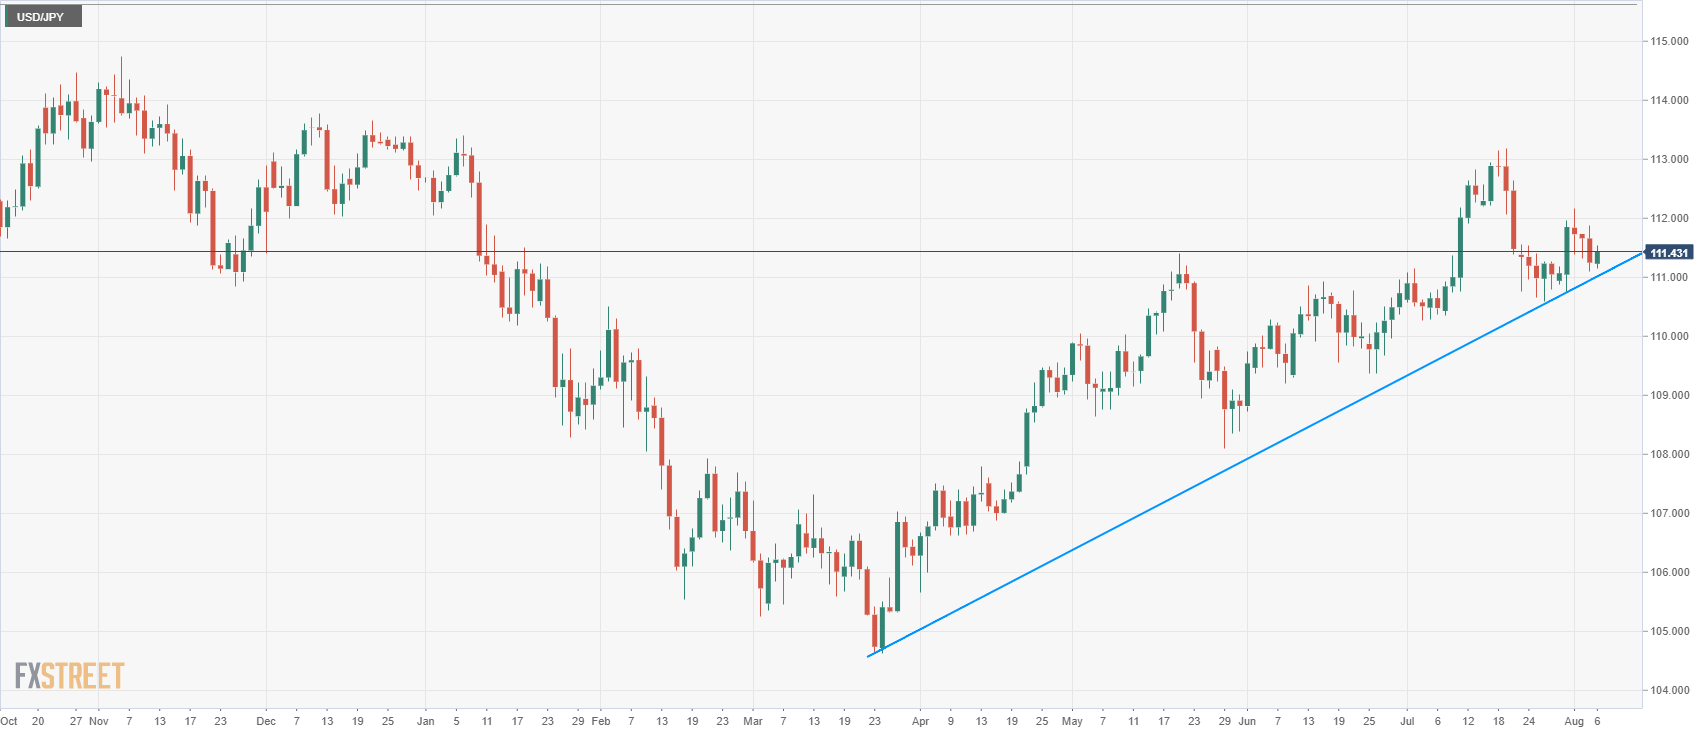
- USD/JPY is struggling to find a clear direction, however, bulls have a slight advantage as they have the long-term trend on their side.
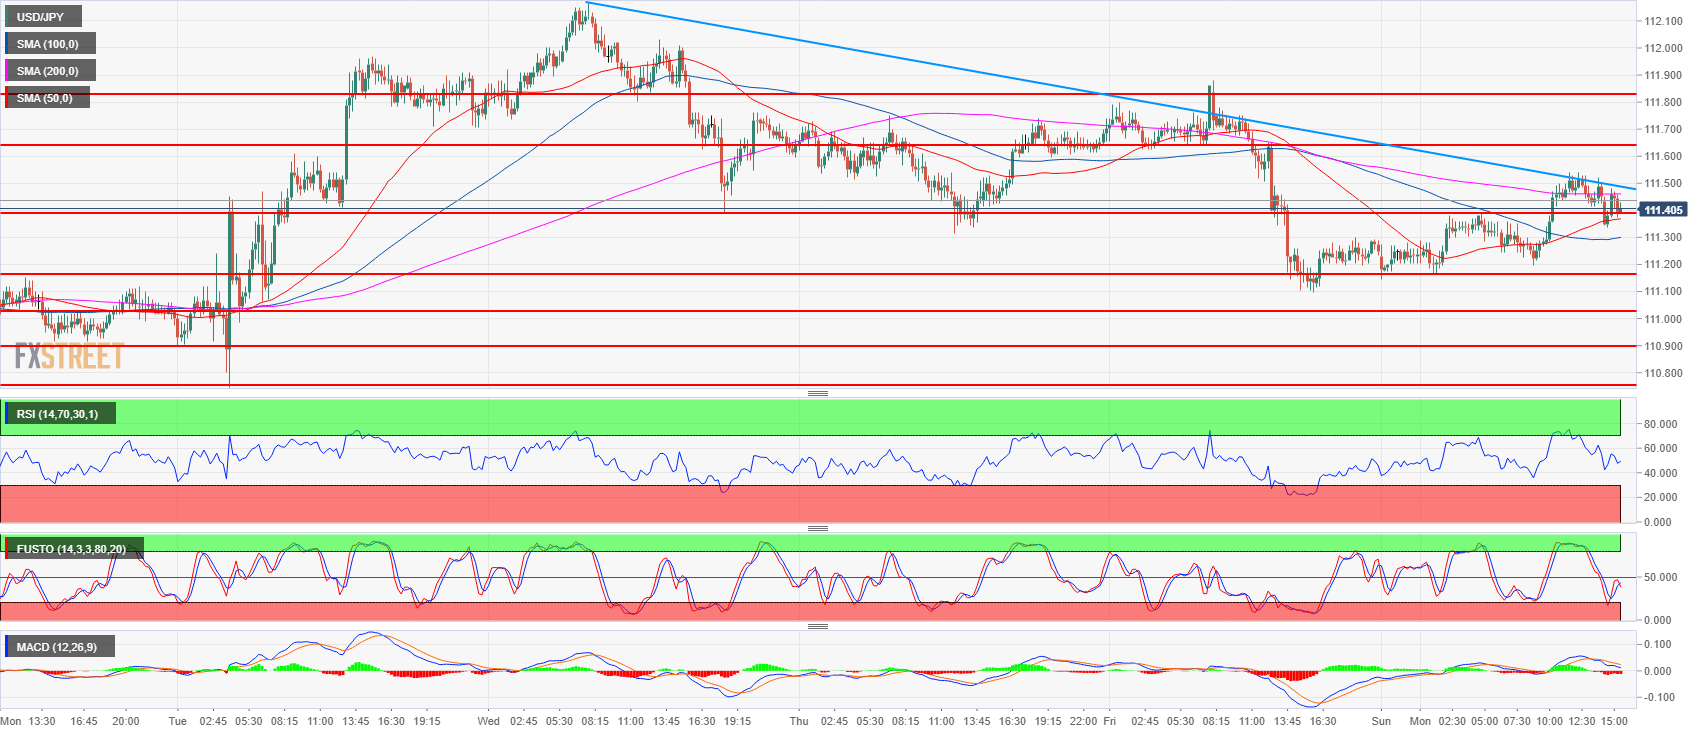
- Bulls objective is to reconquer the 111.82-112.00 area to target 113.18, the 2018 high. Bears want a bear breakout below the 111.02-111.16 area in order to initially retake the swing low at 110.58.

USD/JPY daily chart
Spot rate: 111.39
Relative change: 0.15%
High: 111.54
Low: 111.14
Trend: Neutral to bullish
Resistance 1: 111.39 May 21 swing high
Resistance 2: 111.64 supply/demand level
Resistance 3: 111.82-112.00 area, supply level and figure
Resistance 4: 112.19-112.40 area, July 11 high and intraday swing low
Resistance 5: 112.64 July 12 high
Resistance 6: 113.18, 2018 high
Resistance 7: 113.26-113.38, 200-weekly simple moving average and January 8 high
Resistance 8: 114.45 October 27, 2017 high
Support 1: 111.02-111.16 area, figure and current August 6 low
Support 2: 110.90 June 15 swing high
Support 3: 110.75, July 23 low
Support 4: 110.58 July 26 swing low
Support 5: 110.27 July 4 low
Author

Flavio Tosti
Independent Analyst


