|

USD/JPY technical analysis: 109.20/15 remains on seller’s radar unless 110.55/60 breaks

  • Sustained trading under important resistance portrays pair’s weakness.
  • Sellers can target near-term horizontal support during downside.

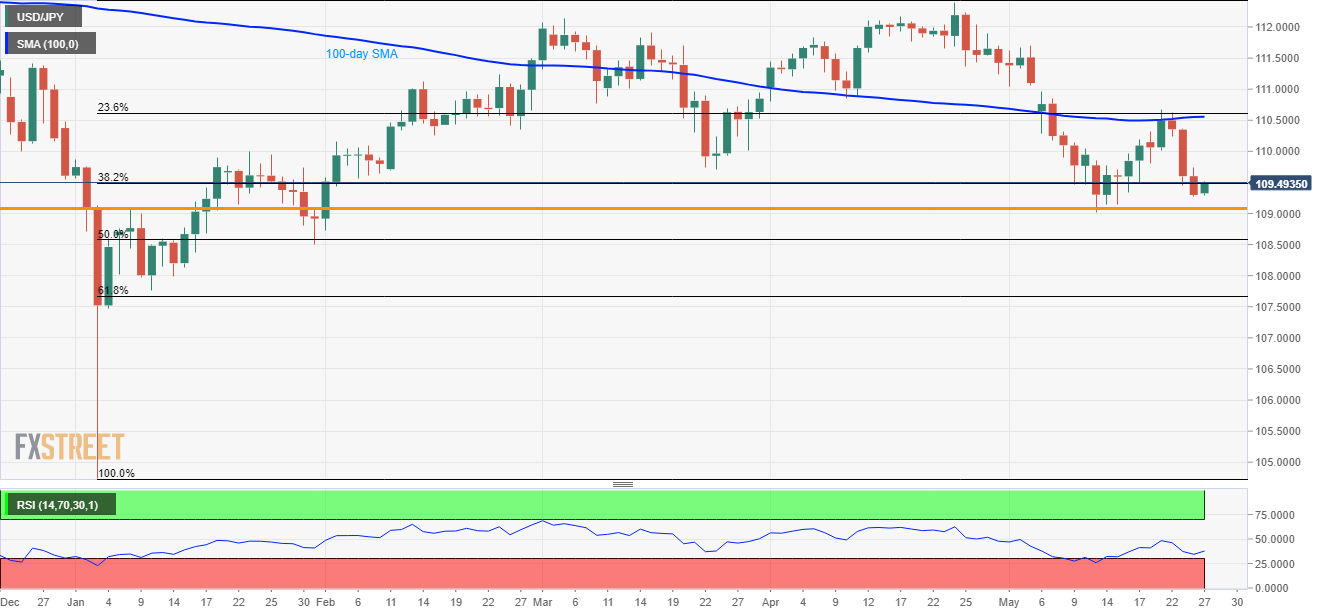
The USD/JPY pair is on the bids near 109.50 ahead of Europe open on Monday.

The 110.55/60 resistance-confluence including 100-day simple moving average (SMA) and 23.6% Fibonacci retracement of January to April rise acts as strong upside cap. Though, 109.80 and 110.30 could entertain buyers during intermediate increase.

Should prices rally past-110.60, 111.00, 111.80 and April month top near 112.40 could be on the bulls’ radar.

Alternatively, multiple lows have been limiting the pair’s downside around 109.20/15 since the year’s start, which if ignored could rely on oversold levels of 14-day relative strength index (RSI) to visit 50% Fibonacci retracement near 108.60.

Given the pair’s extended south-run under 108.60, 108.00 and 107.50 becomes important to watch.

USD/JPY daily chart

Trend: Pullback expected

    1. R3 110.08
    2. R2 109.91
    3. R1 109.61
  1. PP 109.44
    1. S1 109.13
    2. S2 108.97
    3. S3 108.66

Author

Anil Panchal

Anil Panchal

FXStreet

Anil Panchal has nearly 15 years of experience in tracking financial markets. With a keen interest in macroeconomics, Anil aptly tracks global news/updates and stays well-informed about the global financial moves and their implications.

More from Anil Panchal
Share:

Editor's Picks

EUR/USD loses ground below 1.1850 ahead of FOMC Minutes

The EUR/USD pair loses traction near 1.1840 during the early European session on Wednesday, pressured by renewed US Dollar demand. Traders brace for the Federal Open Market Committee Minutes for signals on future rate cuts, which will be released later on Wednesday. 

When is the UK CPI data and how could it affect GBP/USD?

The United Kingdom Consumer Price Index data for January is scheduled to be published today at 07:00 GMT. GBP/USD trades slightly lower at around 1.3556 as of writing. The 20-period Exponential Moving Average trends lower at 1.3593 and continues to cap rebounds. Price holds beneath this gauge, maintaining a short-term bearish bias.

Gold: Is the $5,000 level back in sight?

Gold snaps a two-day downtrend, as recovery gathers traction toward $5,000 on Wednesday. The US Dollar recovers from the overnight sell-off as rebalancing trades resume ahead of Fed Minutes. The 38.2% Fib support holds on the daily chart for now. What does that mean for Gold?

Pi Network rally defies market pressure ahead of its first anniversary

Pi Network is trading above $0.1900 at press time on Wednesday, extending the weekly gains by nearly 8% so far. The steady recovery is supported by a short-term pause in mainnet migration, which reduces pressure on the PI token supply for Centralized Exchanges. The technical outlook focuses on the $0.1919 resistance as bullish momentum increases.

UK jobs market weakens, bolstering rate cut hopes

In the UK, the latest jobs report made for difficult reading. Nonetheless, this represents yet another reminder for the Bank of England that they need to act swiftly given the collapse in inflation expected over the coming months. 

Top 3 Price Prediction: Bitcoin, Ethereum, and Ripple face downside risk as bears regain control

Bitcoin, Ethereum, and Ripple remain under pressure on Wednesday, with the broader trend still sideways. BTC is edging below $68,000, nearing the lower consolidating boundary, while ETH and XRP also declined slightly, approaching their key supports.