USD/JPY Price Forecast: Stuck in tight range around 147.00 as traders await US data
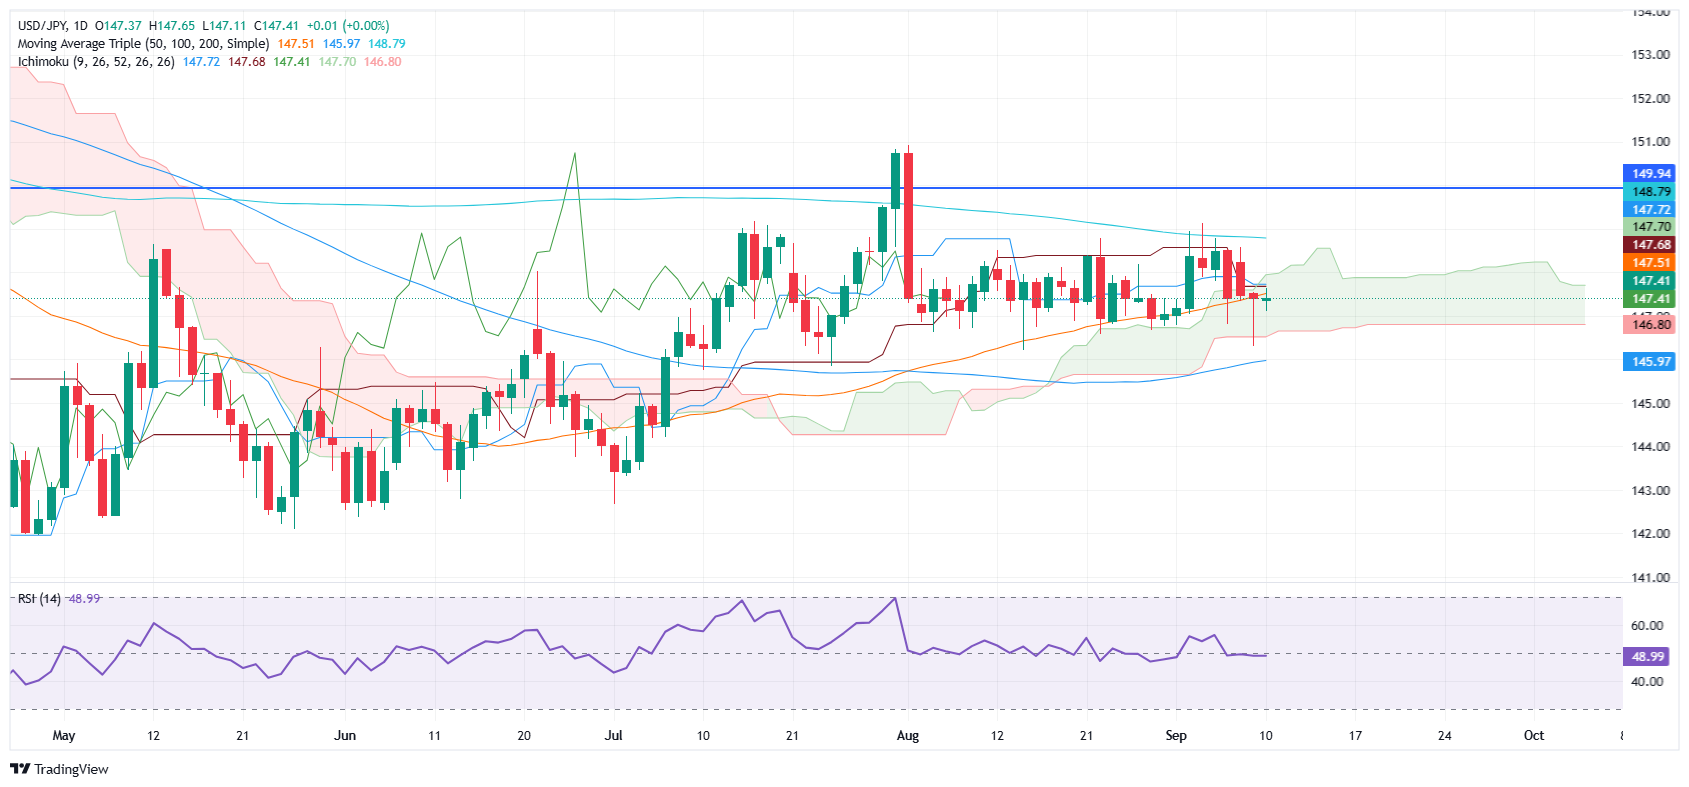
- USD/JPY consolidates for second day, trading near 147.36 as RSI flattens, signaling lack of directional momentum.
- Bulls eye break above 147.50 to target 148.00 and 200-day SMA at 148.69 for further upside.
- Failure to hold 147.00 could trigger slide toward 146.30 weekly low and 100-day SMA at 146.00.

The USD/JPY remains consolidated on Wednesday as buyers and sellers remain unable to move the markets past the 147.00-147.65 range for the last couple of days. At the time of writing, the major sits at 147.36 down a minimal 0.07%.
USD/JPY Price Forecast: Technical outlook
After hitting a weekly low of 146.30 near the 100-day Simple Moving Average (SMA) of 146.00, the USD/JPY cleared the 147.00, an indication that buyers stepped into the markets. However, the release of crucial US economic data prevents traders from opening fresh bets in the pair.
The Relative Strength Index (RSI) is flatlines. Hence, the USD/JPY most likely remains range-bound trading.
If USD/JPY clears 147.50, the next resistance would be 148.00. A breach of the latter will expose the 200-day SMA at148.69. Conversely, if the pair falls below 147.00, expect a move toward the 100-day SMA at 146.00 mark.
USD/JPY Price Chart - Daily
Japanese Yen Price This week
The table below shows the percentage change of Japanese Yen (JPY) against listed major currencies this week. Japanese Yen was the strongest against the Canadian Dollar.
| USD | EUR | GBP | JPY | CAD | AUD | NZD | CHF | |
|---|---|---|---|---|---|---|---|---|
| USD | 0.12% | -0.20% | -0.56% | 0.20% | -0.97% | -0.80% | 0.04% | |
| EUR | -0.12% | -0.36% | -0.60% | 0.11% | -1.09% | -0.88% | -0.10% | |
| GBP | 0.20% | 0.36% | -0.34% | 0.41% | -0.75% | -0.54% | 0.25% | |
| JPY | 0.56% | 0.60% | 0.34% | 0.73% | -0.42% | -0.36% | 0.65% | |
| CAD | -0.20% | -0.11% | -0.41% | -0.73% | -1.03% | -0.97% | -0.18% | |
| AUD | 0.97% | 1.09% | 0.75% | 0.42% | 1.03% | 0.20% | 1.00% | |
| NZD | 0.80% | 0.88% | 0.54% | 0.36% | 0.97% | -0.20% | 0.80% | |
| CHF | -0.04% | 0.10% | -0.25% | -0.65% | 0.18% | -1.00% | -0.80% |
The heat map shows percentage changes of major currencies against each other. The base currency is picked from the left column, while the quote currency is picked from the top row. For example, if you pick the Japanese Yen from the left column and move along the horizontal line to the US Dollar, the percentage change displayed in the box will represent JPY (base)/USD (quote).
Author

Christian Borjon Valencia
FXStreet
Markets analyst, news editor, and trading instructor with over 14 years of experience across FX, commodities, US equity indices, and global macro markets.

















