|

USD/JPY Price Analysis: Yen pair retreats from five-month-old resistance to mid-137.00s

  • USD/JPY prints the first daily loss in six around two-week high.
  • Nearly overbought RSI conditions, key resistance line challenge Yen pair buyers.
  • 200-DMA restricts immediate downside amid bullish MACD signals.

USD/JPY bulls take a breather around 137.50, the highest level in a fortnight, as market sentiment dwindles during early Thursday in Europe. In doing so, the Yen pair prints the first daily loss in six while easing from the downward-sloping resistance line from December 2022.

Not only the sluggish markets and the Yen pair’s inability to cross the key resistance line but the nearly overbought RSI (14) line also favors the quote’s latest pullback.

However, the 200-DMA puts a floor under the USD/JPY prices around the 137.00 round figure.

Following that, the 38.2% Fibonacci retracement level of the Yen pair’s fall from October 2022 to January 2023, near 136.65, may challenge the sellers.

In a case where the USD/JPY remains bearish past 136.65, an upward-sloping support line from March 24 and the 50-DMA, respectively near 134.50 and 133.80, will be in the spotlight.

On the contrary, the USD/JPY pair’s daily closing beyond the aforementioned resistance line, around 137.80 by the press time, needs validation from the 138.00 round figure and late 2022 peak of around 138.20.

Should the Yen pair buyers keep the reins above 138.20, the odds of witnessing a rally toward the 140.00 psychological magnet can’t be ruled out.

Overall, USD/JPY is likely to witness further pullback but the trend remains bullish.

USD/JPY: Daily chart
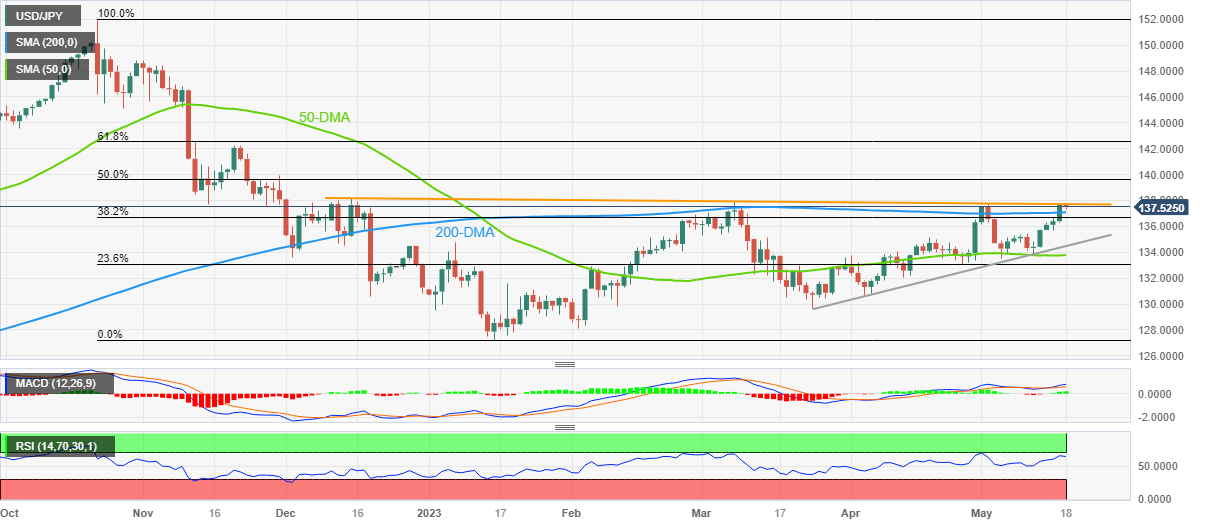
Trend: Bullish

Additional important levels

Overview
Today last price137.49
Today Daily Change-0.19
Today Daily Change %-0.14%
Today daily open137.68
 
Trends
Daily SMA20135.16
Daily SMA50133.75
Daily SMA100133.01
Daily SMA200137.07
 
Levels
Previous Daily High137.71
Previous Daily Low136.31
Previous Weekly High135.77
Previous Weekly Low133.74
Previous Monthly High136.56
Previous Monthly Low130.63
Daily Fibonacci 38.2%137.18
Daily Fibonacci 61.8%136.84
Daily Pivot Point S1136.75
Daily Pivot Point S2135.83
Daily Pivot Point S3135.34
Daily Pivot Point R1138.16
Daily Pivot Point R2138.64
Daily Pivot Point R3139.57

Author

Anil Panchal

Anil Panchal

FXStreet

Anil Panchal has nearly 15 years of experience in tracking financial markets. With a keen interest in macroeconomics, Anil aptly tracks global news/updates and stays well-informed about the global financial moves and their implications.

More from Anil Panchal
Share:

Editor's Picks

EUR/USD stays bid near 1.1560, focus shifts to the ECB

EUR/USD extends its weekly recovery for the third day in a row on Wednesday, navigating in a sidelined fashion around 1.1560 on the back of decent losses in the US Dollar. In the meantime, market participants continue to assess the latest US inflation data while hifting its attention to the ECB event on Thursday.

GBP/USD recedes from tops, hovers around 1.3400

GBP/USD could not sustain the initial bull run and is now slipping back toward the 1.3400 neighbourhood on Wednesday. Cable’s continuation of the ongoing leg higher follows mild selling pressure on the Greenback, despite steady uncertainty on the geopolitical front and elevated US inflation.

Gold bleeding continues as Middle East crisis escalates, Fed hike coming

Gold is accelerating its downward trends and approaches the area of $4,100 per troy ounce on Wednesday, where the 2026 bottom sits so far. The persistent decline in the precious metal almost exclusively follows the swelling opinion that the Fed will keep a cautious stance in H2, a view that was reinforced following earlier US CPI data.

$1,500: Why Ethereum just crashed 20% despite spot markets barely selling
Ethereum (ETH) recently suffered one of its sharpest declines of 2026, dropping more than 20% and briefly testing the $1,500 area. While the sell-off appeared to reflect broader market fears, derivatives and on-chain data suggest a more complex story may be unfolding beneath the surface.
Brutal sell-off: Silver deepens months-long slide, refocusing on $60

Silver has never been known for its calm temperament. The precious metal can spend weeks grinding higher before suddenly giving back months of gains in a matter of days. That volatile reputation has been on full display in recent weeks.

The US economy defies the rules: 100 days into the Oil shock and the recession signal is still missing

More than three months after the start of the Iran war and the resulting disruption to global energy markets, the US economy continues to display remarkable resilience. The conflict has triggered a sharp rise in Oil prices, reignited inflationary pressures and fueled widespread concerns about a potential economic slowdown.