|

USD/JPY Price Analysis: Bulls and bears battle it out at daily resistance

  • USD/JPY bulls in charge but weekly and daily resistance should be noted. 
  • Bears are seeking to hold the bulls off at this juncture.

The bulls are in town according to the monthly chart but the weekly chart is making for a meanwhile resistance and problematic.

The following is a top-down analysis that illustrates the market structure across the time frames and subsequent bias. 

Monthly chart
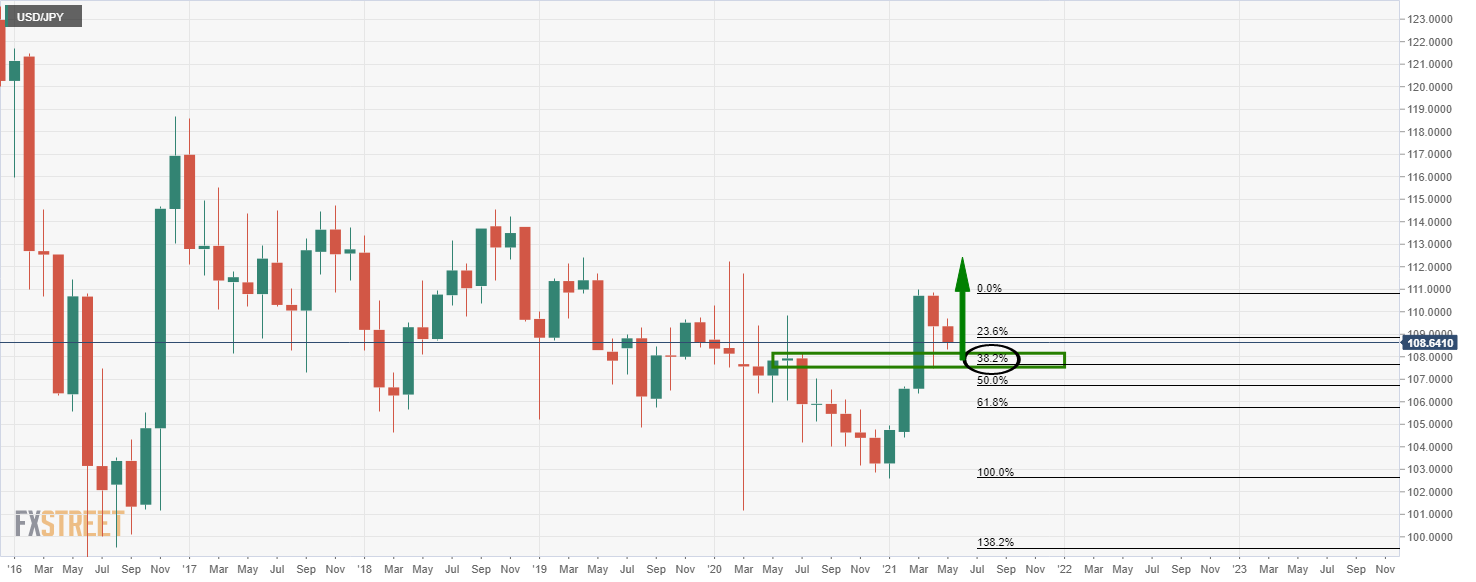
The bullish bias is derived from the recent correction of the monthly bullish impulse to test the prior highs and what would be expected to be a support zone.

The price can rally to fresh highs from here.

Weekly chart
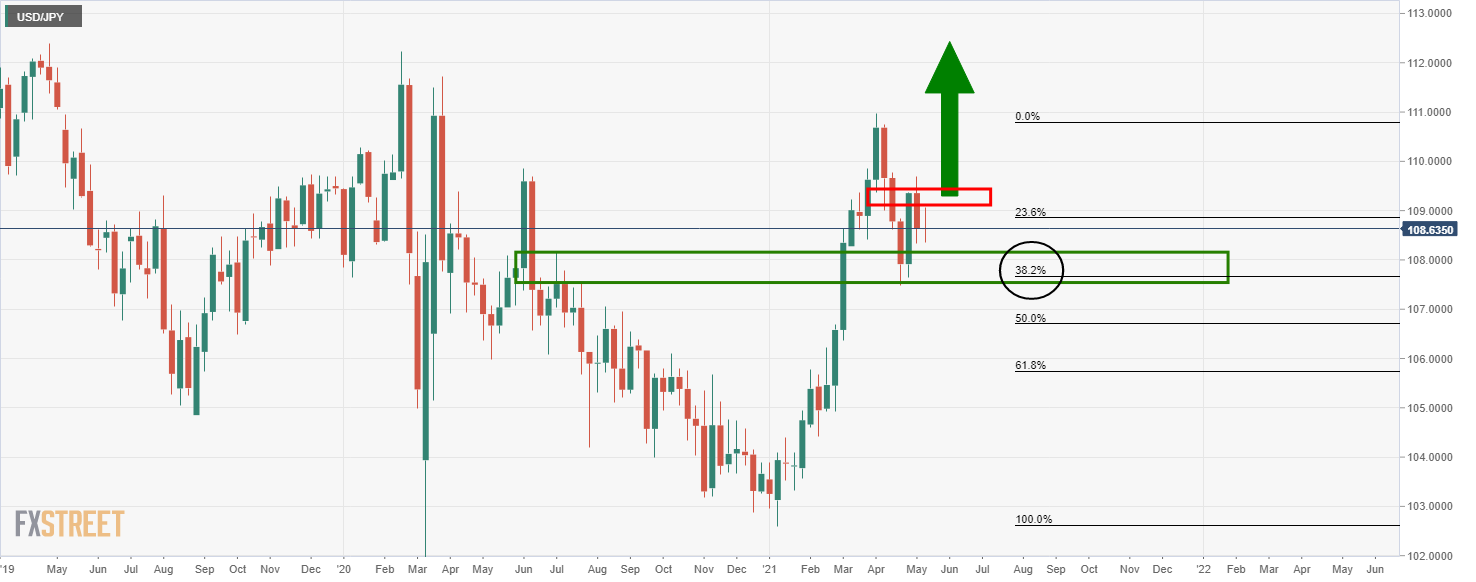
Meanwhile, the weekly resistance is a stumbling block for the bulls. 

Daily chart
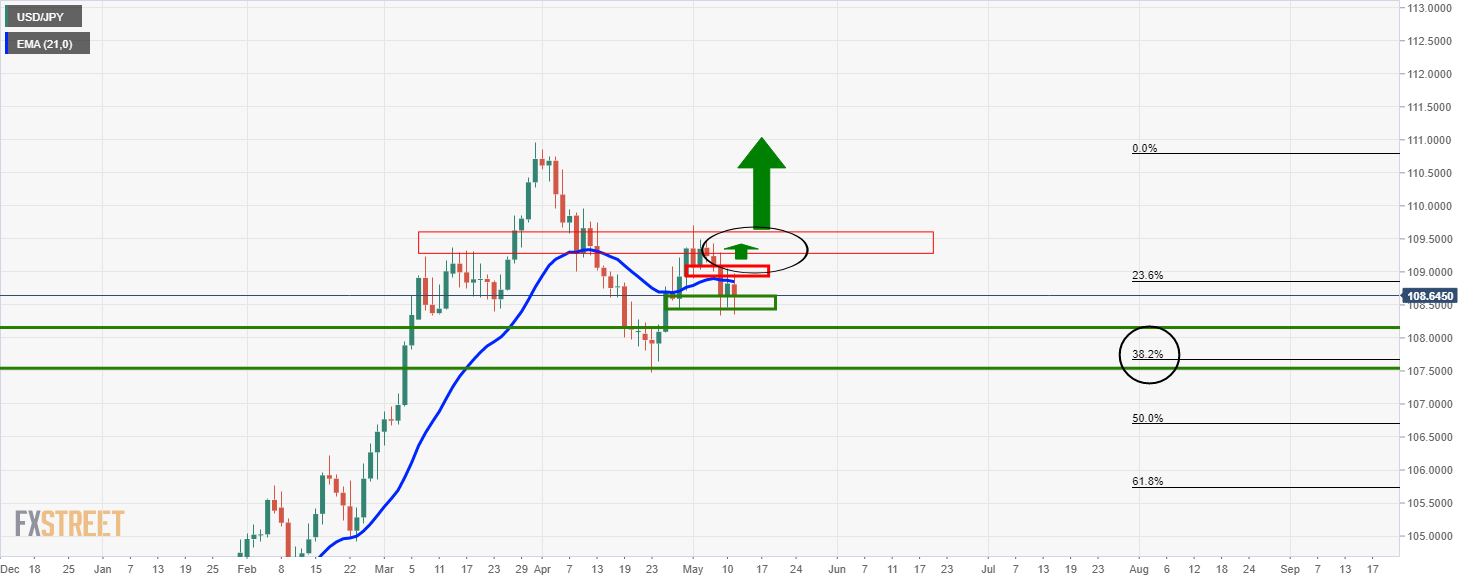
The daily time frame shows that the price is testing a prior support structure in an M-formaiton. 

A beak of this resistance will be highly bullish. 

Author

Ross J Burland

Ross J Burland, born in England, UK, is a sportsman at heart. He played Rugby and Judo for his county, Kent and the South East of England Rugby team.


More from Ross J Burland
Share:

Editor's Picks

AUD/USD challenges four-week highs beyond 0.7000

AUD/USD continues its march north, this time leaving behind the key 0.7000 hurdle and trading at shouting distance from multi-week tops. The persistent recovery in spot comes amid further losses in the Greenback amid extra improvement in the risk complex.

USD/JPY remains confined in a familiar range below 158.50

USD/JPY sees some dip-buying in the Asian session on Wednesday, though it remains confined within a multi-week range near 158.50 as the uncertainty over the timing of the next BoJ rate hike keeps Japanese Yen bulls on the defensive. Meanwhile, hawkish Fed expectations, bolstered by inflation risks stemming from volatile oil prices, underpin the US Dollar. However, looming intervention fears could limit JPY losses and cap the currency pair.

Gold advances modestly; targets $4,150

Gold prices manage to reverse three consecutive daily declines, trading just below the $4,150 mark per troy ounce on Wednesday. The precious metal’s recovery comes amid a slight drop in the US Dollar, mixed US Treasury yields across the board and a widespread cautious tone from the US-Iran front.

Bitcoin eyes a break above $85,000 as institutional demand returns

Bitcoin edges higher above $83,000, extending its rebound from the 50-day EMA near $80,786. US-listed BTC spot ETFs recorded over $23 million in net inflows on Tuesday, following Monday's $526 million, signaling a return of institutional demand.

What November 3 means for the Fed's rate path and the US Dollar

The USD faces a decisive period ahead of the November 3 midterm elections. While markets anticipate another interest rate increase from the Fed in December, the battle for control of Congress could reshape fiscal policy expectations and, indirectly, the path of US monetary policy in 2027.

The US Dollar fell. Gold didn't rally. That tells you everything
Gold (XAU/USD) is struggling to capitalize on a weaker US Dollar (USD), after repeatedly failing to establish itself above the $4,200 level. The precious metal remains confined to a relatively narrow trading range despite a combination of developments that would normally support higher prices.