USD/INR rebounds as FIIs continue to dump Indian stocks
- The Indian Rupee edges down against the US Dollar as FIIs continue to pare stake in the Indian equity market.
- Indian Rupee’s forward premiums correct after the RBI announces 3-year $10 billion USD/INR buy-sell swap.
- The US Q3 GDP unexpectedly expanded at a robust pace of 4.3%.

The Indian Rupee (INR) faces selling pressure against the US Dollar (USD) on Wednesday. The USD/INR pair recovers to near 90.20, but is broadly in the corrective phase, following the Reserve Bank of India’s (RBI) intervention last week.
The RBI sold US Dollars in the spot and Non-Deliverable Forward (NDF) market in two trading days: Wednesday and Friday, last week to support the Indian Rupee against one-way depreciation.
However, investors refrain from relying on the Indian Rupee’s recovery as Foreign Institutional Investors (FIIs) continue to offload their stake in the Indian stock market. So far in December, FIIs have remained net sellers in 14 out of 17 trading days, and have sold shares worth Rs. 22,109.51 crore.
Market experts believe that overseas investors are unlikely to return to the Indian equity market until a bilateral deal between the United States (US) and India is announced.
Meanwhile, the USD/INR January month-end forward premium has eased to 41 paisa from a peak of 58 paisa seen on Tuesday after the Reserve Bank of India (RBI) announced on Tuesday that it would conduct a 3-year $10 billion USD/INR buy-sell swap next month, Reuters reported.
The table below shows the percentage change of Indian Rupee (INR) against listed major currencies today. Indian Rupee was the weakest against the Japanese Yen.
| USD | EUR | GBP | JPY | CAD | AUD | INR | CHF | |
|---|---|---|---|---|---|---|---|---|
| USD | -0.07% | -0.17% | -0.28% | -0.12% | -0.19% | 0.34% | -0.18% | |
| EUR | 0.07% | -0.10% | -0.24% | -0.05% | -0.12% | 0.41% | -0.11% | |
| GBP | 0.17% | 0.10% | -0.13% | 0.04% | -0.02% | 0.51% | -0.01% | |
| JPY | 0.28% | 0.24% | 0.13% | 0.19% | 0.11% | 0.64% | 0.11% | |
| CAD | 0.12% | 0.05% | -0.04% | -0.19% | -0.08% | 0.46% | -0.07% | |
| AUD | 0.19% | 0.12% | 0.02% | -0.11% | 0.08% | 0.54% | -0.03% | |
| INR | -0.34% | -0.41% | -0.51% | -0.64% | -0.46% | -0.54% | -0.52% | |
| CHF | 0.18% | 0.11% | 0.01% | -0.11% | 0.07% | 0.03% | 0.52% |
The heat map shows percentage changes of major currencies against each other. The base currency is picked from the left column, while the quote currency is picked from the top row. For example, if you pick the Indian Rupee from the left column and move along the horizontal line to the US Dollar, the percentage change displayed in the box will represent INR (base)/USD (quote).
Fed dovish bets for 2026 remain firm despite strong US Q3 GDP data
- The Indian Rupee falls marginally against the US Dollar, even as the latter trades vulnerably due to firm expectations that the Federal Reserve (Fed) will deliver at least 50 basis points (bps) reduction in interest rates in 2026.
- In Asian trading hours, the US Dollar Index (DXY), which tracks the Greenback’s value against six major currencies, posts a fresh 11-week low at 97.75.
- The CME FedWatch tool shows that the odds of the Fed reducing interest rates at least 50 bps in 2026 are 70.6%. Market speculation towards the scope of US interest rate cuts is higher than what the Fed signaled in its dot plot last week. The Fed’s dot plot showed that policymakers collectively see the Federal Funds Rate heading to 3.4% by the end of 2026, indicating that there won’t be more than one interest rate cut.
- Fed dovish expectations are intensified due to weak job market conditions and hopes that tariffs won’t de-anchor inflation expectations.
- Meanwhile, surprisingly upbeat US Q3 Gross Domestic Product (GDP) data has failed to deliver a material impact on Fed dovish speculation. The GDP report showed on Tuesday that the economy grew at an annualized pace of 4.3%, stronger than 3.8% in the second quarter. Economists expected the GDP growth to come in lower at 3.3%.
- Going forward, the US Dollar is expected to trade on the sidelines amid holidays in the FX market on account of Christmas and Boxing Day.
Technical Analysis: USD/INR strives to return above 20-day EMA
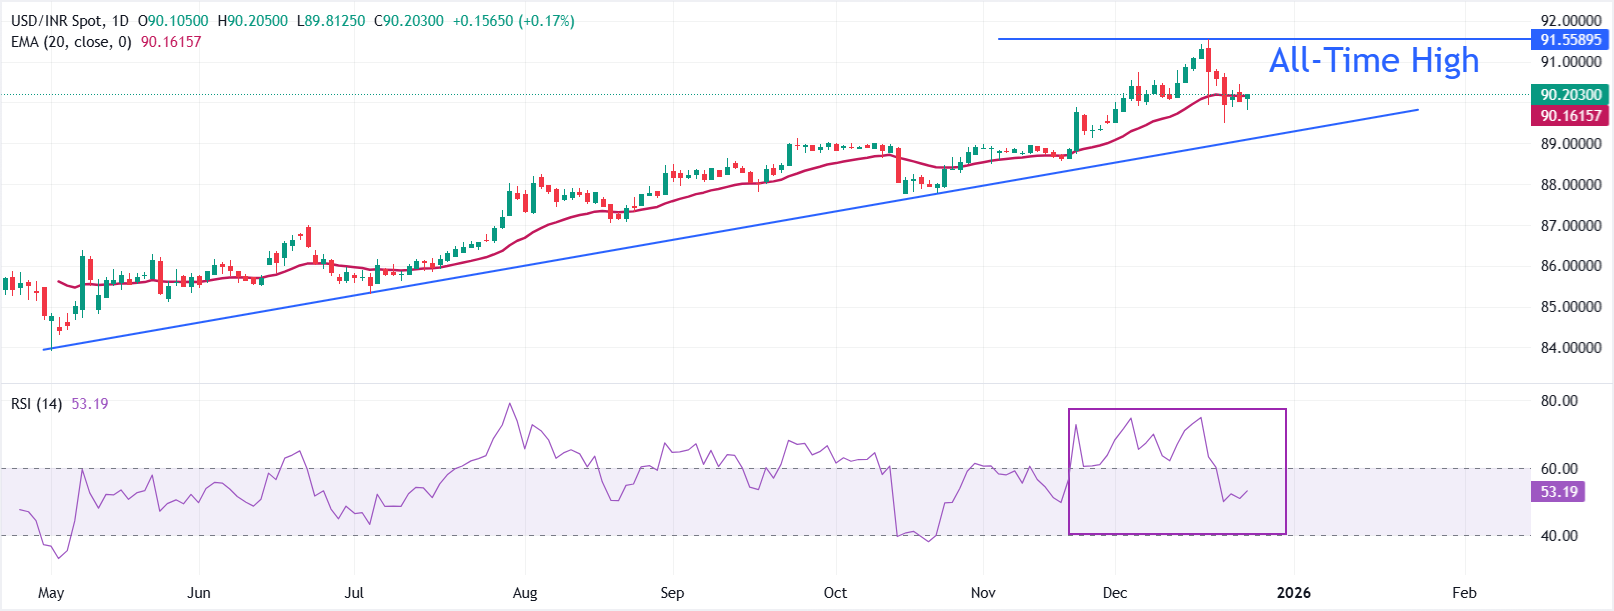
-In the daily chart, USD/INR trades at 90.2085. It holds above the 20-day EMA at 90.1621, though the average has begun to flatten after a steady climb, preserving a mild bullish bias. RSI at 53 (neutral) reflects cooled momentum from prior overbought readings. The rising trend line from 83.9428 underpins the setup, with support aligning near 89.1667. Holding above the average keeps the bias positive, while a close below trend support would turn the tone lower.
Momentum has eased, yet the broader uptrend remains anchored by trend support. RSI near the midline lacks directional impulse; a push back into the 60s would reinforce bullish appetite. While the structure holds, pullbacks would attract buyers, and the pair could extend higher. A break of the supporting line would open the door to a deeper retracement.
(The technical analysis of this story was written with the help of an AI tool.)
US Dollar FAQs
The US Dollar (USD) is the official currency of the United States of America, and the ‘de facto’ currency of a significant number of other countries where it is found in circulation alongside local notes. It is the most heavily traded currency in the world, accounting for over 88% of all global foreign exchange turnover, or an average of $6.6 trillion in transactions per day, according to data from 2022. Following the second world war, the USD took over from the British Pound as the world’s reserve currency. For most of its history, the US Dollar was backed by Gold, until the Bretton Woods Agreement in 1971 when the Gold Standard went away.
The most important single factor impacting on the value of the US Dollar is monetary policy, which is shaped by the Federal Reserve (Fed). The Fed has two mandates: to achieve price stability (control inflation) and foster full employment. Its primary tool to achieve these two goals is by adjusting interest rates. When prices are rising too quickly and inflation is above the Fed’s 2% target, the Fed will raise rates, which helps the USD value. When inflation falls below 2% or the Unemployment Rate is too high, the Fed may lower interest rates, which weighs on the Greenback.
In extreme situations, the Federal Reserve can also print more Dollars and enact quantitative easing (QE). QE is the process by which the Fed substantially increases the flow of credit in a stuck financial system. It is a non-standard policy measure used when credit has dried up because banks will not lend to each other (out of the fear of counterparty default). It is a last resort when simply lowering interest rates is unlikely to achieve the necessary result. It was the Fed’s weapon of choice to combat the credit crunch that occurred during the Great Financial Crisis in 2008. It involves the Fed printing more Dollars and using them to buy US government bonds predominantly from financial institutions. QE usually leads to a weaker US Dollar.
Quantitative tightening (QT) is the reverse process whereby the Federal Reserve stops buying bonds from financial institutions and does not reinvest the principal from the bonds it holds maturing in new purchases. It is usually positive for the US Dollar.
Author

Sagar Dua
FXStreet
Sagar Dua is associated with the financial markets from his college days. Along with pursuing post-graduation in Commerce in 2014, he started his markets training with chart analysis.


