USD/INR technical analysis: U-turn from 61.8% Fibo. recalls 50-day EMA
- USD/INR trades below 50% Fibonacci retracement level.
- Reversal from 61.8% Fibonacci retracement shifts market focus to 50-day EMA support.
- An upside clearance of the key Fibonacci level could print fresh yearly high.

Having reversed from 61.8% Fibonacci retracement of October 2018 to July 2019 downpour, USD/INR declines to 71.23 ahead of Thursday’s European session.
The pair now aims to visit the 50-day exponential moving average (EMA) level of 70.90 prior to targeting 70.45, including 100-day EMA, during further declines.
During the pair’s additional weakens below 70.45, June month high surrounding 70.12 and 70.00 round-figure will flash on sellers’ radar.
Also supporting the quote’s downside is a bearish signal from the 12-bar moving average convergence and divergence (MACD) indicator.
Alternatively, 50% and 61.8% Fibonacci retracement levels around 71.60 and 72.40 seem to limit pair’s near-term advances, a break of which could print fresh 2019 high by surpassing latest peak near 72.65.
USD/INR daily chart
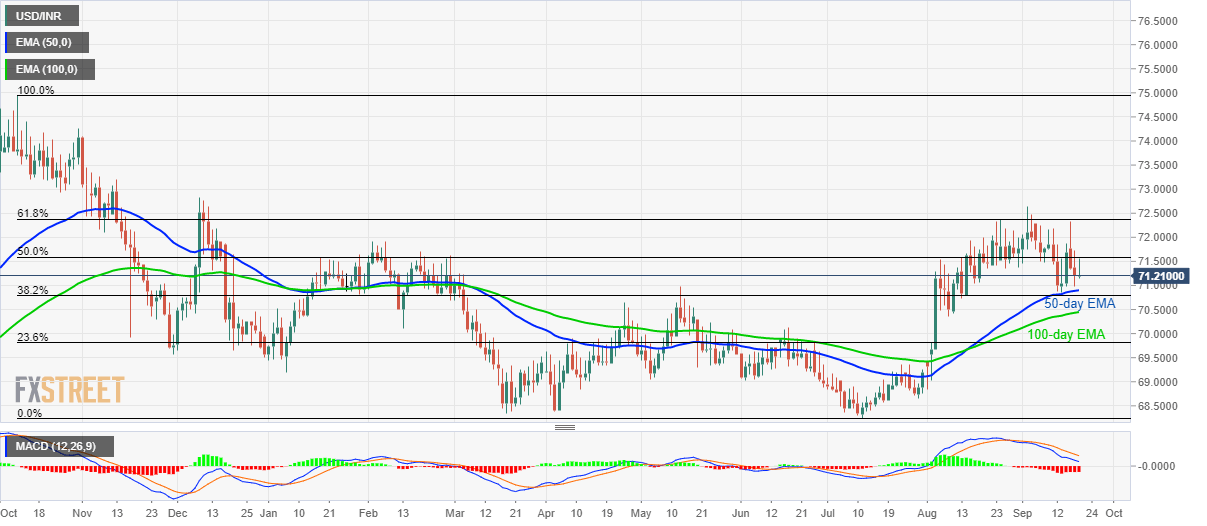
Trend: bearish
Author

Anil Panchal
FXStreet
Anil Panchal has nearly 15 years of experience in tracking financial markets. With a keen interest in macroeconomics, Anil aptly tracks global news/updates and stays well-informed about the global financial moves and their implications.


