USD/INR Technical Analysis: Oversold RSI conditions signal pullback from 61.8% Fibo.
- USD/INR drops to the lowest in 13-days.
- Oversold RSI conditions could pull the pair back towards 100-bar SMA.
- The two-week-old resistance line adds to the resistance.

Following its sustained trading below 100-bar Simple Moving Average (SMA), USD/INR declines to 71.24 by the press time of Thursday’s early Asian session.
The quote nears 61.8% Fibonacci retracement of the current month rise while the 14-bar Relative Strength Index (RSI) indicate oversold conditions.
As a result, prices are likely to witness a pullback towards 100-bar Simple Moving Average (SMA) level of 71.60 with 50% Fibonacci retracement near 71.44 acting as immediate resistance.
Though, a downward sloping trend line since November 14, at 71.72 now, could keep the buyers in check during the pair’s rise beyond 71.44.
On the downside, pair’s declines below 61.8% Fibonacci retracement level of 71.20 can take aim at 71.00 and 70.50.
USD/INR 4-hour chart
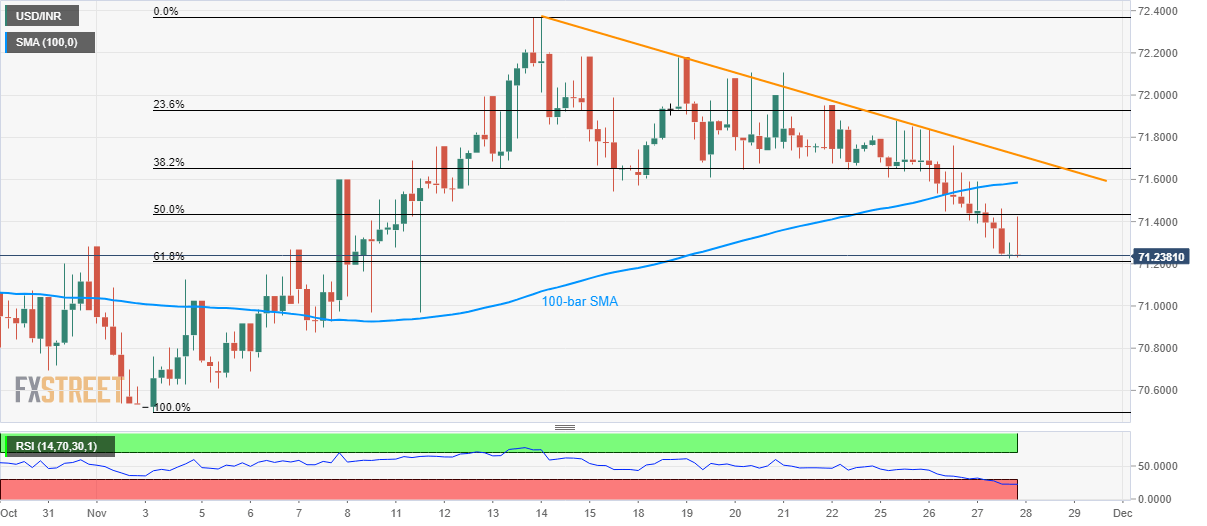
Trend: Pullback expected
Author

Anil Panchal
FXStreet
Anil Panchal has nearly 15 years of experience in tracking financial markets. With a keen interest in macroeconomics, Anil aptly tracks global news/updates and stays well-informed about the global financial moves and their implications.


