|

USD/INR Technical Analysis: Five-month rising trendline breached

  • USD/INR has invalidated a five-month uptrend line. 
  • The daily chart indicators are biased bearish. 

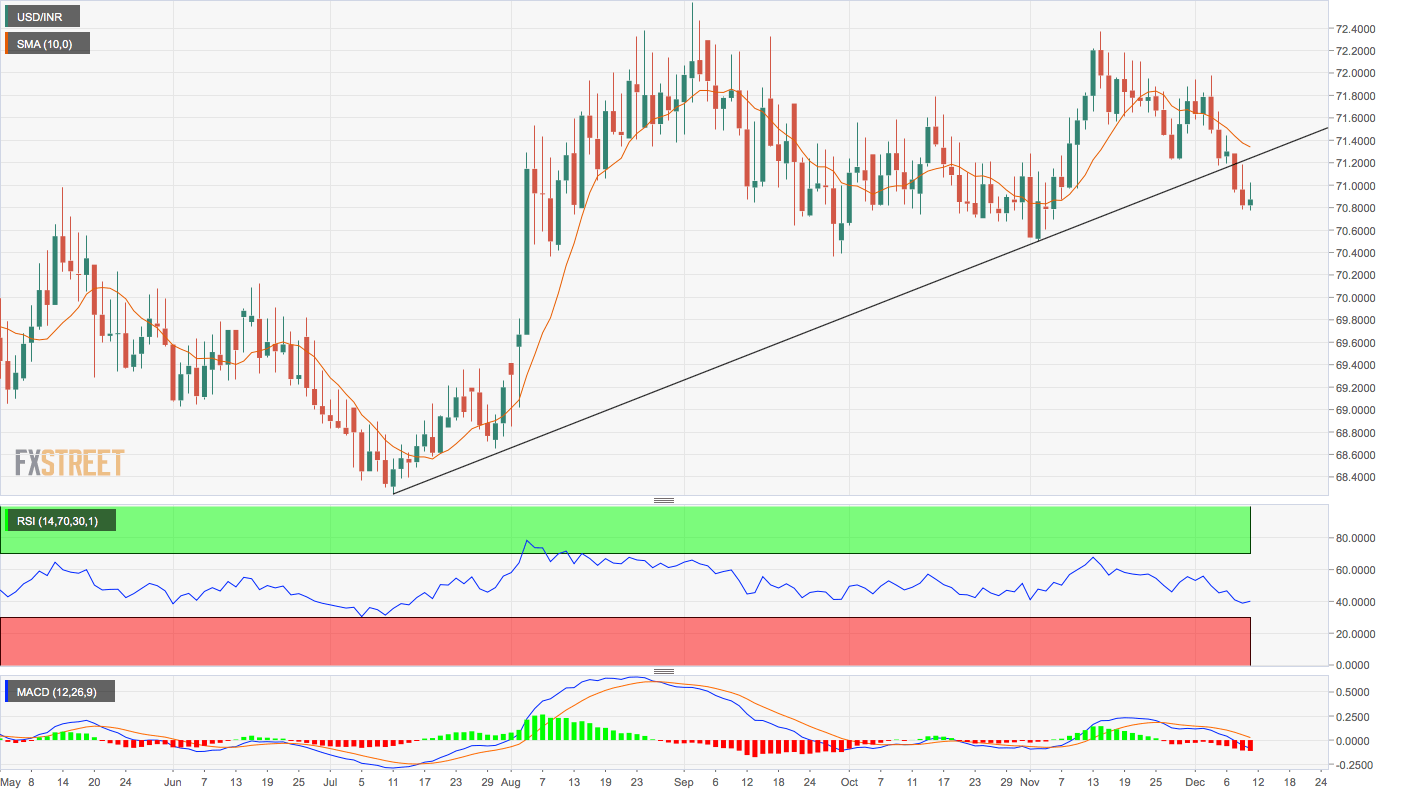
USD/INR has breached a five-month uptrend line and could bring in deeper support levels into play with the daily chart indicators reporting bearish conditions. 

The pair closed at 70.90 on Monday, violating the trendline connecting July 11 and Nov. 1 lows and dropped further to 70.77 on Tuesday, cementing the breakdown. 

The 14-day relative strength index is hovering in bearish territory below 50 and the MACD histogram is printing deeper bars below the zero line – a sign of strengthening downside momentum. 

The pair appears on track to test support at 70.31 (Nov. 1 low). 

While corrective spikes cannot be ruled out in the event of strong oil price rise, the bearish technical outlook would be invalidated only if the pair closes above the descending 10-day average, currently at 71.26. 

Daily chart

Trend: Bearish

Technical levels

USD/INR

Overview
Today last price70.8725
Today Daily Change0.0523
Today Daily Change %0.07
Today daily open70.8202
 
Trends
Daily SMA2071.59
Daily SMA5071.2704
Daily SMA10071.1395
Daily SMA20070.2474
 
Levels
Previous Daily High71.18
Previous Daily Low70.785
Previous Weekly High71.98
Previous Weekly Low71.1775
Previous Monthly High72.37
Previous Monthly Low70.4975
Daily Fibonacci 38.2%70.9359
Daily Fibonacci 61.8%71.0291
Daily Pivot Point S170.6768
Daily Pivot Point S270.5334
Daily Pivot Point S370.2818
Daily Pivot Point R171.0718
Daily Pivot Point R271.3234
Daily Pivot Point R371.4668

Author

Omkar Godbole

Omkar Godbole

FXStreet Contributor

Omkar Godbole, editor and analyst, joined FXStreet after four years as a research analyst at several Indian brokerage companies.

More from Omkar Godbole
Share:

Editor's Picks

Japanese Yen weakens to two-year lows, targets 162.00

USD/JPY extends its advance well north of the 161.00 barrier on Thursday, always on the back of the continuation of the US Dollar's post-Fed rebound and despite warnings from the BoJ of a potential intervention at any time. Next on the upside for spot comes the July 2024 peak in levels just shy of 162.00 the figure.

AUD/USD trims gains, challenges 0.7000

AUD/USD now alternates gains with losses just above the key 0.7000 level ahead of the opening bell in Asia. The pair clinches its third consecutive daily retracement, always on the back of the persistent move higher in the Greenback, particularly following the Fed’s hawkish hold on Wednesday.

Gold drops to daily lows near $4,200

Gold struggles to attract buyers on Thursday, trading closer to the $4,200 mark per troy ounce. The yellow metal adds to Wednesday’s pullback and slips back to multi-day lows in response to the stronger US Dollar following the Fed’s hawkish hold on Wednesday.

XRP vulnerable below key EMA resistance levels
Ripple (XRP) ticks down below $1.20 with short-term support at $1.16 intact at the time of writing on Thursday. An early-week rally was rejected at $1.28, weighing on sentiment as traders broadly de-risked.
Regime change: Inside Kevin Warsh's first move to make the Fed unreadable on purpose

The rate did not move. That was the least interesting thing about Kevin Warsh's first meeting in charge of the Fed. The FOMC held its benchmark at 3.50%-3.75% for the fourth straight meeting, exactly as priced, and then the new chair used his first press conference to dismantle the machinery the market has leaned on for a decade.

The next big AI trade may not be about chips or software

Artificial intelligence has already created some of the biggest winners in modern market history. Chipmakers have surged, data centre construction is booming, and electricity demand forecasts are changing globally.