|

USD/INR technical analysis: Choppy inside a Pennant formation

  • Having flashed a multi-month high, USD/INR forms a Pennant pattern on the 4-hour chart.
  • A generally trend-continuation formation is being challenged by overbought RSI.

USD/INR follows a week-long Pennant formation while making the rounds to 70.94 ahead of the European session opening on Monday.

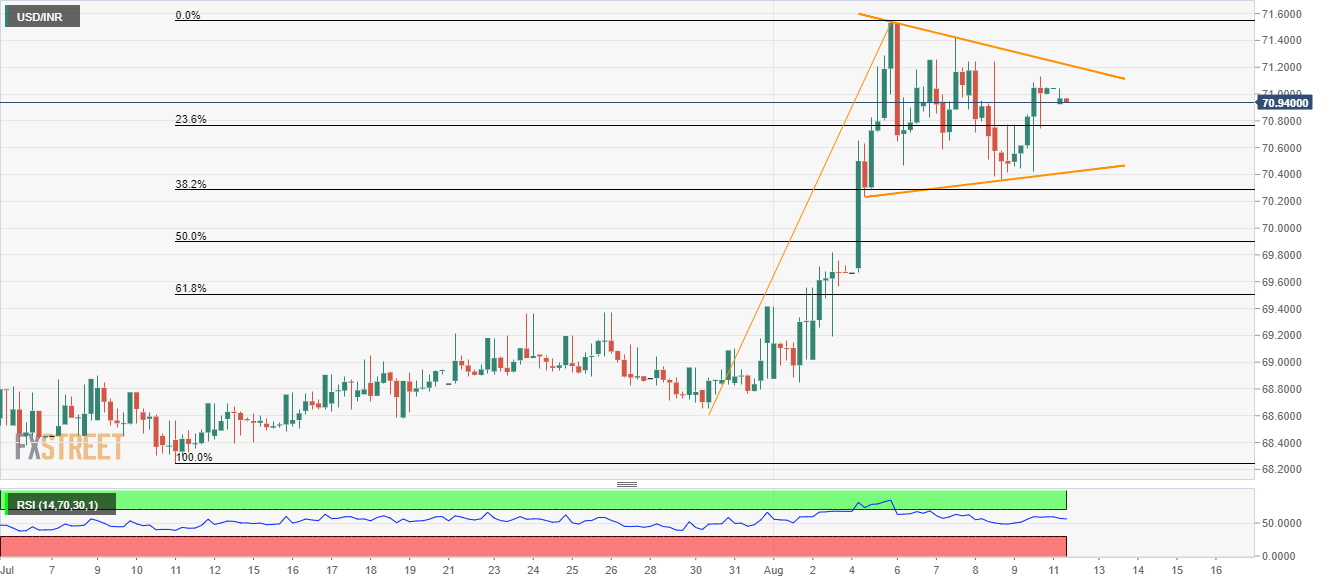
Prices are currently capped in a range between 71.22 and 70.40 with 71.53 and 69.82 being following levels to watch during either side breakouts.

The Pennant formation generally continues the trend but overbought levels of 14-bar relative strength, in this case, might tame the bulls targeting February high close to 72.00.

On the downside, July 30 low near 68.65 and July 11 bottom around 68.25 can please bears during further declines below 69.82.

USD/INR 4-hour chart

Trend: Sideways

    1. R3 72.0312 
    2. R2 71.5826 
    3. R1 71.3133 
  1. PP 70.8647 
    1. S1 70.5954
    2. S2  70.1468
    3. S3  69.8775

Author

Anil Panchal

Anil Panchal

FXStreet

Anil Panchal has nearly 15 years of experience in tracking financial markets. With a keen interest in macroeconomics, Anil aptly tracks global news/updates and stays well-informed about the global financial moves and their implications.

More from Anil Panchal
Share:

Editor's Picks

EUR/USD treads water around 1.1900

EUR/USD edges a tad lower around the 1.1900 area, coming under mild pressure despite the US Dollar keeps the offered stance on turnaround Tuesday. On the US data front, December Retail Sales fell short of expectations, while the ADP four week average printed at 6.5K.

GBP/USD looks weak near 1.3670

GBP/USD trades on the back foot around the 1.3670 region on Tuesday. Cable’s modest retracement also comes in tandem with the decent decline in the Greenback. Moving forward, the US NFP and CPI data in combination with key UK releases should kee the quid under scrutiny in the next few days.

Gold the battle of wills continues with bulls not ready to give up

Gold comes under marked selling pressure on Tuesday, giving back part of its recent two day advance and threatening to challenge the key $5,000 mark per troy ounce. The yellow metal’s correction follows a better tone in the risk complex, a lower Greenback and shrinking US Treasuty yields.

AI Crypto Update: BankrCoin, Pippin surge as sector market cap steadies above $12B

The Artificial Intelligence (AI) segment is largely on the back foot with major coins such as Bittensor (TAO) and Internet Computer (ICP) extending losses amid a sticky risk-off sentiment.

Dollar drops and stocks rally: The week of reckoning for US economic data

Following a sizeable move lower in US technology Stocks last week, we have witnessed a meaningful recovery unfold. The USD Index is in a concerning position; the monthly price continues to hold the south channel support.

XRP holds $1.40 amid ETF inflows and stable derivatives market

Ripple trades under pressure, with immediate support at $1.40 holding at the time of writing on Tuesday. A recovery attempt from last week’s sell-off to $1.12 stalled at $1.54 on Friday, leading to limited price action between the current support and the resistance.