|

USD/INR Price News: Indian rupee sellers attack 74.00 on Dragonfly Doji near key SMA joint

  • USD/INR extends the previous day’s recovery moves, refreshes intraday high.
  • Bullish candlestick, strong support battle bearish MACD near monthly low.
  • Three-week-old horizontal resistance tests buyers but sellers have a bumpy road ahead.

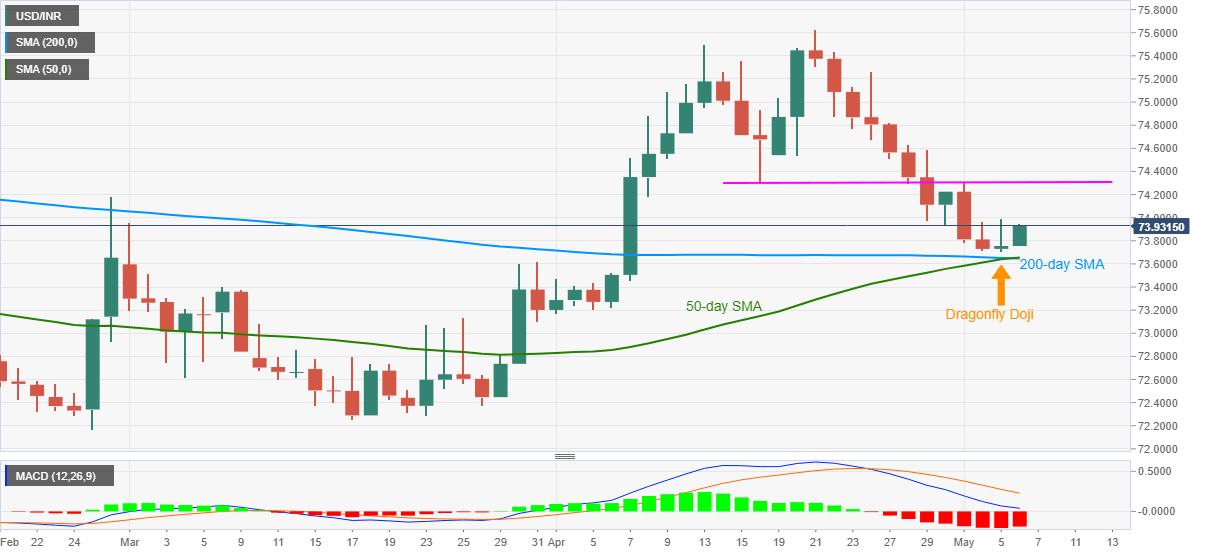
USD/INR stays well bid around intraday top of 73.95, up 0.22% on a day, amid the initial Indian session on Thursday. In doing so, the quote justifies the previous day’s bullish candlestick above a convergence of 50-day and 200-day SMA.

While the recent corrective pullback is ready to cross the 74.00 threshold, late February tops near 74.20 and a short-term horizontal line close to 74.30 will challenge the further upside.

If at all USD/INR buyers keep reins above 74.30, odds of witnessing the 75.00 round-figure on the chart can’t be ruled out.

Alternatively, a daily closing below 73.65 won’t be enough for USD/INR seller’s entry as March month’s top near 73.60 add extra filter to the south.

Even if the bears manage to break 73.60, multiple levels near 73.20-15 and the 73.00 round-figure may trouble them during further downside.

USD/INR daily chart

Trend: Further recovery expected

Additional important levels

Overview
Today last price73.9525
Today Daily Change0.1978
Today Daily Change %0.27%
Today daily open73.7547
 
Trends
Daily SMA2074.643
Daily SMA5073.6398
Daily SMA10073.3559
Daily SMA20073.6526
 
Levels
Previous Daily High73.997
Previous Daily Low73.7068
Previous Weekly High75.2685
Previous Weekly Low73.9361
Previous Monthly High75.6321
Previous Monthly Low73.1696
Daily Fibonacci 38.2%73.8862
Daily Fibonacci 61.8%73.8177
Daily Pivot Point S173.642
Daily Pivot Point S273.5293
Daily Pivot Point S373.3517
Daily Pivot Point R173.9322
Daily Pivot Point R274.1098
Daily Pivot Point R374.2225

Author

Anil Panchal

Anil Panchal

FXStreet

Anil Panchal has nearly 15 years of experience in tracking financial markets. With a keen interest in macroeconomics, Anil aptly tracks global news/updates and stays well-informed about the global financial moves and their implications.

More from Anil Panchal
Share:

Editor's Picks

EUR/USD remains weak near 1.1800

EUR/USD remains on the back foot on Thursday, trading close to the 1.1800 support ahead of the opening bell in Asia. The pair’s pullback comes amid further gains in the Greenback, while investors keep assessing the ECB’s decision to leave its policy rates unchanged

GBP/USD drops to two-week low, around 1.3500

The GBP/USD pair adds to the previous day's dovish Bank of England-inspired heavy losses and drifts lower for the third straight day on Friday. The downward trajectory is sponsored by sustained US Dollar buying and drags spot prices to a two-week low during the Asian session, with bears now awaiting a break below the 1.3500 psychological mark before placing fresh bets.

Gold reverses a dip to $4,650 as bargain hunters emerge

Gold price is reversing a sharp sell-off to near $4,650 in the Asian session on Friday, re-attempting the $4,800 level. The precious metal finds fresh dip-buying demand amid broad risk aversion. Gold fell in early trades, extending the previous decline as traders cover losses from equities and adjust positions. The preliminary reading of the Michigan Consumer Sentiment Index report will be eyed later on Friday. 

Bitcoin and top cryptos plummet further as analyst terms market crash 'structural'

Bitcoin has declined below $65,000 on Thursday, down 11% over the past 24 hours. The move marks its largest decline since the October 10 leverage flush. Since then, the top crypto has erased more than 50% of its value since the October 10 leverage flush.

The AI mirror just turned on tech and nobody likes the reflection

Tech just got hit with a different kind of selloff. Not the usual rates tantrum, not a recession whisper, not even an earnings miss in the classic sense. This was the market staring into an AI mirror and recoiling at its reflection.

Bitcoin and top cryptos plummet further as analyst terms market crash 'structural'

Bitcoin has declined below $65,000 on Thursday, down 11% over the past 24 hours. The move marks its largest decline since the October 10 leverage flush. Since then, the top crypto has erased more than 50% of its value since the October 10 leverage flush.