- USD/INR takes the bids to refresh intraday high, rises the most in two weeks.
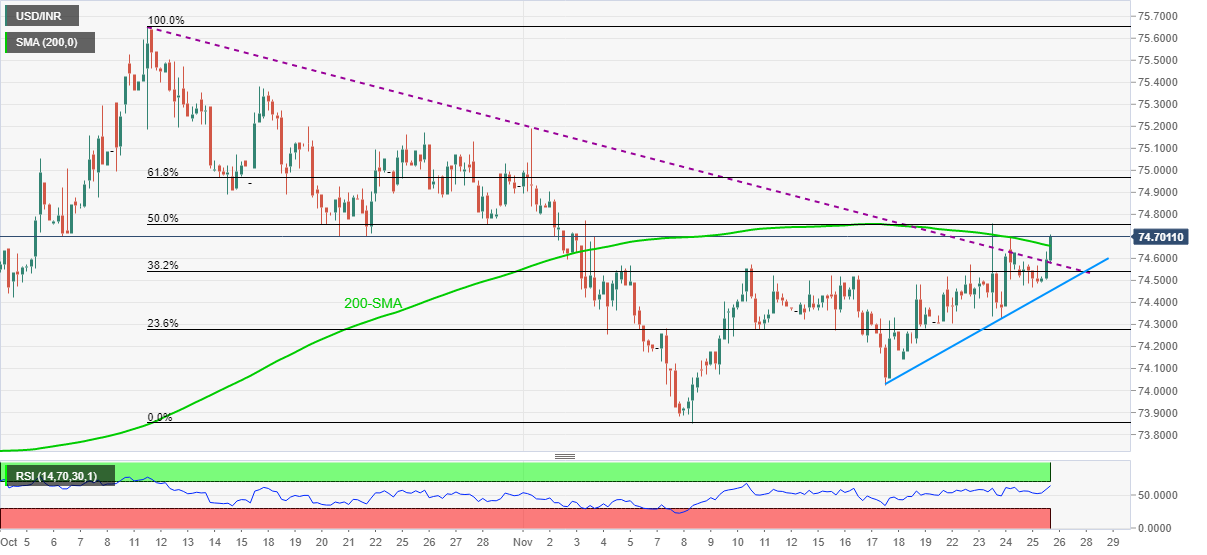
- Clear upside break of six-week-old trend line, 200-SMA joins upbeat RSI to favor buyers.
- 50% Fibonacci retracement will validate the run-up towards 75.00.
USD/INR jumps the most in a week, refreshes intraday high to 74.70 during Friday’s European morning.
The Indian rupee (INR) pair’s run-up could be linked to the successful break of a descending trend line from October 12 and 200-SMA. Given the absence of overbought RSI, the upside momentum has further room towards the north.
However, 50% Fibonacci retracement (Fibo.) of October-November declines, around 74.75, acts as a validation point for the quote’s run-up towards the 75.00 threshold.
Following that, a monthly high of 75.20 and an October 18 peak of 75.37 may entertain USD/INR bulls before directing them to the last month’s top near 75.65.
On the contrary, a daily closing below the stated resistance-turned-support line of 74.58 will aim for the weekly support line near 74.45.
It should be noted, however, that the USD/INR weakness past 74.45 will make it vulnerable to decline towards the 74.00 round figure, comprising the November 18 low.
USD/INR: Four-hour chart
Trend: Further upside expected
Information on these pages contains forward-looking statements that involve risks and uncertainties. Markets and instruments profiled on this page are for informational purposes only and should not in any way come across as a recommendation to buy or sell in these assets. You should do your own thorough research before making any investment decisions. FXStreet does not in any way guarantee that this information is free from mistakes, errors, or material misstatements. It also does not guarantee that this information is of a timely nature. Investing in Open Markets involves a great deal of risk, including the loss of all or a portion of your investment, as well as emotional distress. All risks, losses and costs associated with investing, including total loss of principal, are your responsibility. The views and opinions expressed in this article are those of the authors and do not necessarily reflect the official policy or position of FXStreet nor its advertisers. The author will not be held responsible for information that is found at the end of links posted on this page.
If not otherwise explicitly mentioned in the body of the article, at the time of writing, the author has no position in any stock mentioned in this article and no business relationship with any company mentioned. The author has not received compensation for writing this article, other than from FXStreet.
FXStreet and the author do not provide personalized recommendations. The author makes no representations as to the accuracy, completeness, or suitability of this information. FXStreet and the author will not be liable for any errors, omissions or any losses, injuries or damages arising from this information and its display or use. Errors and omissions excepted.
The author and FXStreet are not registered investment advisors and nothing in this article is intended to be investment advice.
Recommended content
Editors’ Picks
EUR/USD trades weak below 1.0800 amid Good Friday lull, ahead of US PCE
EUR/USD remains depressed below 1.0800 after soft French inflation data, amid minimal volatility and thin liquidity on Good Friday. The pair keenly awaits the US PCE inflation data and Fed Chair Powell's speech for fresh hints on next week's price action.
GBP/USD holds steady above 1.2600 as markets stay calm on Good Friday
GBP/USD trades sideways above 1.2600 amid a typical Good Friday trading lull. A broadly firmer US Dollar could keep any upside attempts limited in the pair ahead of the US PCE inflation data and Fed Chair Powell's appearance.
Gold price sits at all-time highs above $2,230, US PCE eyed
Gold price hit all-time highs at $2,236 on Thursday to finish Q1 2024 with a bang. Most major world markets, including the US are closed due to Holy Friday, leaving volatility around Gold price highly subdued. US PCE inflation and Powell are awaited.
Jito price could hit $6 as JTO coils up inside this bullish pattern
Jito (JTO) price has been on an uptrend since forming a local bottom in early January. Since then, JTO has revisited the key swing point formed in early December, suggesting the bulls’ intention to move higher.
Key events in developed markets next week
Next week, the main focus will be inflation and the labour market in the Eurozone. We expect services inflation to be impacted by the easter effect, while the unemployment rate to be unchanged.