|

USD/INR Price News: 50-DMA tests India rupee sellers below 75.00

  • USD/INR bounces off four-month-old support line, monthly low to snap two-day downtrend.
  • Bearish MACD, 50-DMA challenge recovery moves, 100-DMA adds to the downside filters.

USD/INR pare recent losses around 74.77, up 0.07% intraday during the late Asian session on Wednesday.

The Indian rupee (INR) pair dropped to the lowest levels since November 26 the previous day before bouncing off 74.58. The corrective pullback took place near an ascending trend line from early September, as well as the 100-DMA.

However, the 50-DMA level of 74.96 guards the quote’s immediate upside amid bearish MACD signals.

Even if the USD/INR buyers cross the 74.96 hurdle, the 75.00 threshold and a two-week-old descending trend line close to 75.25, will test the further upside before convincing the bulls.

Alternatively, the 100-DMA adds strength to the 74.58-53 support zone, a break of which will quickly recall the 74.00 round figure to the chart.

However, the USD/INR pair’s further weakness will make it vulnerable to test November’s low of 73.85.

USD/INR: Daily chart

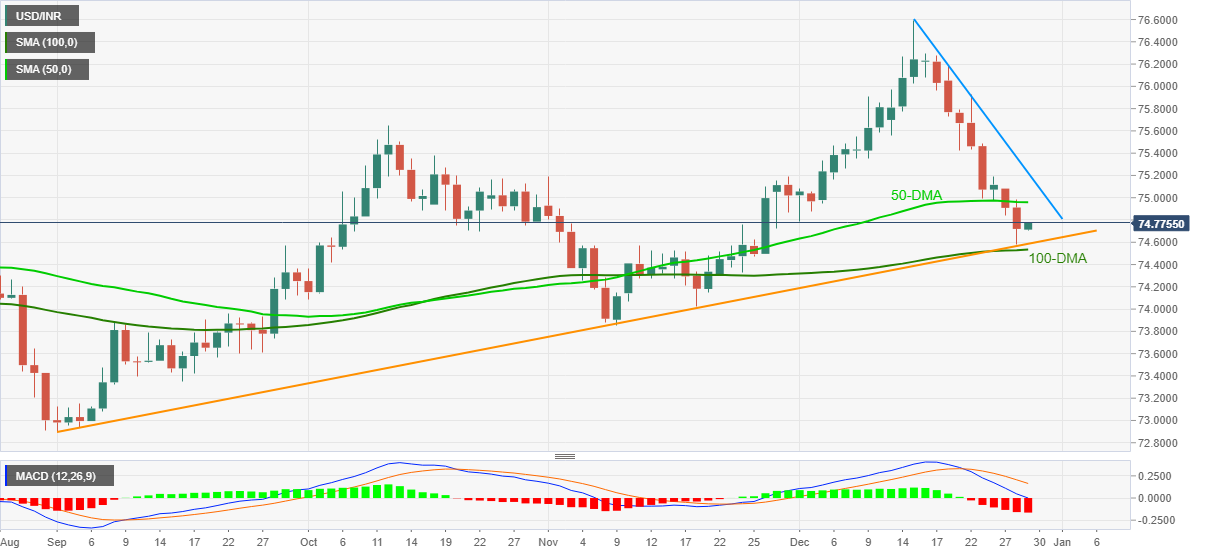
Trend: Bearish bias remains intact

Additional important levels

Overview
Today last price74.7515
Today Daily Change0.0315
Today Daily Change %0.04%
Today daily open74.72
 
Trends
Daily SMA2075.5028
Daily SMA5074.9608
Daily SMA10074.5282
Daily SMA20074.2292
 
Levels
Previous Daily High74.9818
Previous Daily Low74.58
Previous Weekly High76.1832
Previous Weekly Low74.9755
Previous Monthly High75.1908
Previous Monthly Low73.8515
Daily Fibonacci 38.2%74.7335
Daily Fibonacci 61.8%74.8283
Daily Pivot Point S174.5394
Daily Pivot Point S274.3588
Daily Pivot Point S374.1377
Daily Pivot Point R174.9412
Daily Pivot Point R275.1623
Daily Pivot Point R375.3429

Author

Anil Panchal

Anil Panchal

FXStreet

Anil Panchal has nearly 15 years of experience in tracking financial markets. With a keen interest in macroeconomics, Anil aptly tracks global news/updates and stays well-informed about the global financial moves and their implications.

More from Anil Panchal
Share:

Editor's Picks

EUR/USD looks to regain the 200-day SMA

EUR/USD regains some balance and trade just above 1.1600 the figure ahead of the opening bell in Asia. The pair initially dipped to the 1.1530 zone for the first time since November, always following the stronger US Dollar and the marked flight-to-safety in the context of the ongoing Middle East crisis
 

GBP/USD attacks 1.3300, refreshing three-month lows

GBP/USD is deep in the red near 1.3300, accelerating its downside to renew three-month lows in European trading on Tuesday. The ongoing escalation in the Iran war, combined with rising Oil prices, weighs negatively on the higher-yielding Pound Sterling as the US Dollar capitalizes on increased haven demand.

Gold bounces off lows, back above $5,100

Gold remains on the defensive, eroding part of the recent multi-day advance and managing to trade back above the $5,100 mark per troy ounce on Tuesday. The precious metal initially dropped just below the critical $5,000 threshold on the back of the persistent strength of the Greenback, higher US Treasury yields across the curve and investors' repricing of Fed rate cuts.

XRP risks extending losses as US-Iran war rages on

Ripple (XRP) has come under pressure, drifting lower to $1.35 at the time of writing on Tuesday. The over 2% correction looks poised to erase the previous day’s gains, which lifted the remittance token to $1.42.

Energy shock 2.0: Why rising Gas prices could hit the Euro

Even without a confirmed, sustained disruption, the mere risk to a key global energy chokepoint is enough to inject a significant premium into European Gas markets. And for the Euro, that matters.

Ripple falters amid sell-off jitters and negative funding rates

Ripple (XRP) has come under pressure, drifting lower to $1.35 at the time of writing on Tuesday. The over 2% correction looks poised to erase the previous day’s gains, which lifted the remittance token to $1.42.