|

USD/INR Price Analysis: Indian Rupee buyers approach 81.45 resistance confluence

  • USD/INR remains pressured at 11-week low, down for the third consecutive day.
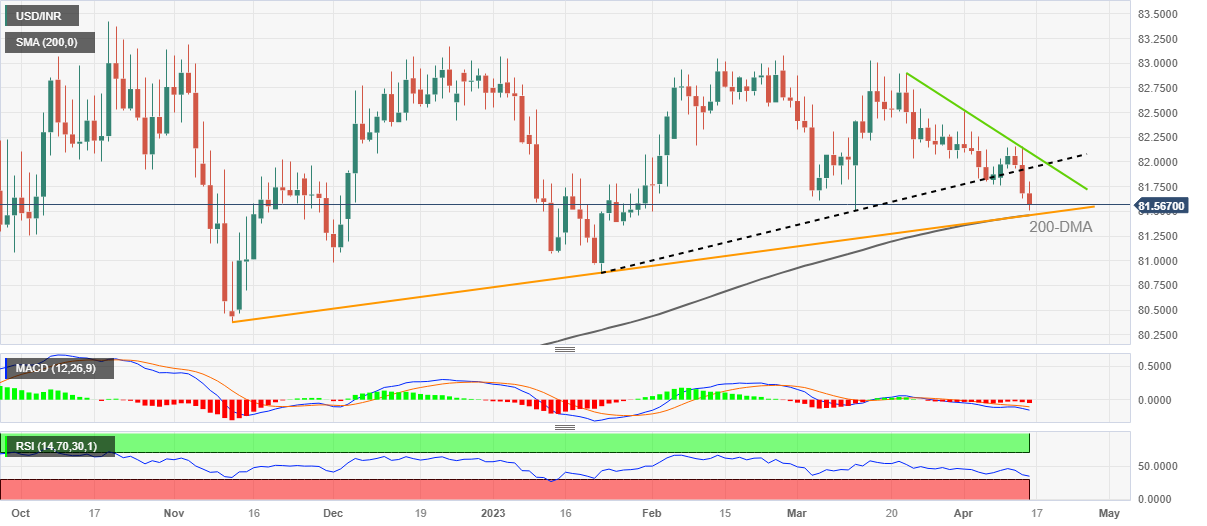
  • Clear downside break of ascending trend line from late January, bearish MACD signals favor Indian Rupee (INR) buyers.
  • Convergence of 200-DMA, five-month-old rising support line restricts immediate downside of USD/INR.
  • Indian Rupee sellers remain off the table below 82.10.

USD/INR clings to mild losses around 81.60 during early Friday, after falling to the lowest levels since late January before a few minutes.

In doing so, the Indian Rupee (INR) pair justifies the previous day’s downside break of an upward-sloping support line from January 23, now resistance. Adding strength to the bearish bias are the downbeat MACD signals.

However, the RSI (14) line is approaching the oversold territory and signals bottom picking of the USD/INR prices, which in turn highlights the 81.45 support confluence as the key for the USD/INR bears to watch. That said, the stated level encompasses the 200-DMA and an ascending trend line from November 2022.

If at all the USD/INR bears dominate past 81.45 and offer a daily closing below the same, the November 2022 low near 81.00 and the yearly trough surrounding 80.90 will be in the spotlight.

Meanwhile, recovery remains elusive unless the Indian Rupee pair remains below the support-turned-resistance line stretched from January, close to 81.95 by the press time.

Even if the USD/INR buyers manage to cross the 81.95 hurdle, the 82.00 round figure and a three-week-old descending resistance line, close to 82.10 at the latest, will be crucial challenges for them to conquer.

USD/INR Price: Daily chart

Trend: Limited downside expected

Additional important levels

Overview
Today last price81.585
Today Daily Change-0.0970
Today Daily Change %-0.12%
Today daily open81.682
 
Trends
Daily SMA2082.1685
Daily SMA5082.3723
Daily SMA10082.2173
Daily SMA20081.4517
 
Levels
Previous Daily High82.16
Previous Daily Low81.63
Previous Weekly High82.5092
Previous Weekly Low81.7741
Previous Monthly High83.0315
Previous Monthly Low81.512
Daily Fibonacci 38.2%81.8325
Daily Fibonacci 61.8%81.9576
Daily Pivot Point S181.488
Daily Pivot Point S281.294
Daily Pivot Point S380.958
Daily Pivot Point R182.018
Daily Pivot Point R282.354
Daily Pivot Point R382.548

Author

Anil Panchal

Anil Panchal

FXStreet

Anil Panchal has nearly 15 years of experience in tracking financial markets. With a keen interest in macroeconomics, Anil aptly tracks global news/updates and stays well-informed about the global financial moves and their implications.

More from Anil Panchal
Share:

Markets move fast. We move first.

Orange Juice Newsletter brings you expert driven insights - not headlines. Every day on your inbox.

By subscribing you agree to our Terms and conditions.

Editor's Picks

EUR/USD recovers to 1.1750 region as 2025 draws to a close

Following the bearish action seen in the European session on Wednesday, EUR/USD regains its traction and recovery to the 1.1750 region. Nevertheless, the pair's volatility remains low as trading conditions thin out on the last day of the year.

GBP/USD stays weak near 1.3450 on modest USD recovery

GBP/USD remains under modest beairsh pressure and fluctuates at around 1.3450 on Wednesday. The US Dollar finds fresh demand due to the end-of-the-year position adjustments, weighing on the pair amid the pre-New Year trading lull. 

Gold retreats to $4,300 area, looks to post monthly gains

Gold stays on the back foot on the last day of 2025 and trades near $4,300, possibly pressured by profit-taking and position adjustments. Nevertheless, XAU/USD remains on track to post gains for December and extend its winning streak into a fifth consecutive month.

Bitcoin, Ethereum and XRP prepare for a potential New Year rebound

Bitcoin, Ethereum, and Ripple are holding steady on Wednesday after recording minor gains on the previous day. Technically, Bitcoin could extend gains within a triangle pattern while Ethereum and Ripple face critical overhead resistance. 

Economic outlook 2026-2027 in advanced countries: Solidity test

After a year marked by global economic resilience and ending on a note of optimism, 2026 looks promising and could be a year of solid economic performance. In our baseline scenario, we expect most of the supportive factors at work in 2025 to continue to play a role in 2026.

Crypto market outlook for 2026

Year 2025 was volatile, as crypto often is.  Among positive catalysts were favourable regulatory changes in the U.S., rise of Digital Asset Treasuries (DAT), adoption of AI and tokenization of Real-World-Assets (RWA).