|

USD/INR Price Analysis: Bulls await sustained strength and acceptance above 83.00 mark

  • USD/INR edges higher on Thursday, albeit remains confined in a three-day-old trading band.
  • The constructive technical setup favours bullish traders and supports prospects for further gains.
  • A convincing break below the 100/200-day SMAs confluence will negate the positive outlook.

The USD/INR pair trades with a positive bias during the Asian session on Thursday, though remains below the 83.00 mark and well within a familiar trading range held over the past three days.

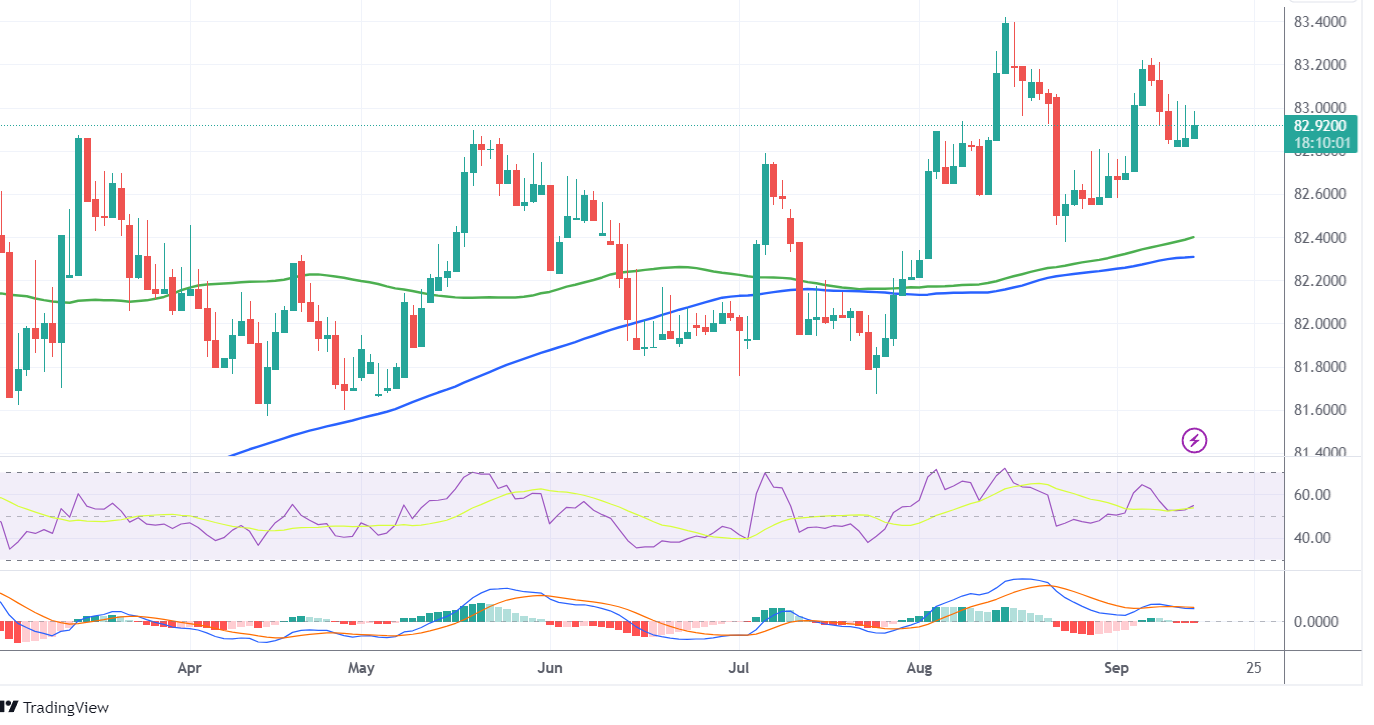
From a technical perspective, spot prices are holding comfortably above technically significant 100-day and 200-day Simple Moving Averages (SMAs). Moreover, positive oscillators on the daily chart – though have been losing traction – favour bullish traders and suggest that the path of least resistance for the USD/INR pair is to the upside.

That said, it will still be prudent to wait for sustained strength and acceptance above the 83.00 round figure before positioning for any further move up. The USD/INR pair might then climb back towards last week's swing high, around the 83.20-83.25 region, and then aim to challenge the record high, around the 83.45 region touched in August.

A sustained strength beyond the 83.00 mark will reaffirm the constructive setup and lift the pair back towards last week's swing high, around the 83.20-83.25 region. This is followed by the 83.45 region, or the record high touched in August, which if cleared decisively will be seen as a fresh trigger for bulls and pave the way for additional gains.

On the flip side, weakness below the 82.80 area, or the weekly low, might continue to attract some dip-buying and remain limited near the 82.40-82.30 confluence, comprising the 100-day and the 200-day SMAs. The latter should act as a pivotal point, which if broken will make the USD/INR pair vulnerable to accelerate the slide towards the 82.00 mark.

Some follow-through selling below the July monthly swing low, around the 81.70-81.65 region, will suggest that spot prices have formed a near-term top and pave the way for a deeper corrective decline. The USD/INR pair might then weaken further towards the 81.35 intermediate support before eventually dropping towards testing sub-81.00 levels.

USD/INR daily chart

Technical levels to watch

USD/INR

Overview
Today last price82.9424
Today Daily Change-0.0562
Today Daily Change %-0.07
Today daily open82.9986
 
Trends
Daily SMA2082.9001
Daily SMA5082.6534
Daily SMA10082.4361
Daily SMA20082.3408
 
Levels
Previous Daily High83.1171
Previous Daily Low81.5345
Previous Weekly High83.3714
Previous Weekly Low82.585
Previous Monthly High83.5505
Previous Monthly Low82.224
Daily Fibonacci 38.2%82.5125
Daily Fibonacci 61.8%82.139
Daily Pivot Point S181.983
Daily Pivot Point S280.9675
Daily Pivot Point S380.4005
Daily Pivot Point R183.5656
Daily Pivot Point R284.1326
Daily Pivot Point R385.1481

Author

Haresh Menghani

Haresh Menghani is a detail-oriented professional with 10+ years of extensive experience in analysing the global financial markets.

More from Haresh Menghani
Share:

Editor's Picks

AUD/USD regains mild traction, falters near 0.7150

AUD/USD gathers some steam and manages to flirt with the 0.7150 level on Thursday. However, the pair has retraced some of Wednesday’s significant pullback due to renewed selling pressure on the Greenback and a slight improvement in risk sentiment following hopes of a deal in the Middle East. Wrapping up the Australian docket, the RBA’s Hauser will speak early on Friday.

USD/JPY trades below 160.00 intervention threshold; bullish bias intact

The USD/JPY pair attracts some sellers during the Asian session amid fears that authorities will step in again to prop up the Japanese Yen. Furthermore, the Israel-Lebanon truce prompts some profit-taking around the US Dollar and exerts downward pressure on the currency pair.

Gold puts its 200-day SMA to the test near $4,420

Gold keeps the bullish stance in place in the latter part of Thursday’s session, although a convincing break above the key $4,500 mark per troy ounce still remains elusive. The precious metal’s advance comes amid the resurgence of some selling interest around the Greenback, improving risk sentiment, and declining US Treasury yields across the board.

XRP plummets as ETF outflows, geopolitical tensions reinforce bearish outlook
Ripple (XRP) edges lower, trading around $1.15 at the time of writing on Thursday, its lowest price since February 6. The cross-border money remittance token is extending the sell-off for the fifth consecutive day, reflecting persistent headwinds from ongoing geopolitical tensions and investor uncertainty.
Nonfarm payrolls: Testing the limits of Fed policy patience

The upcoming nonfarm payrolls report for May will provide the final update on the US labor market before Kevin Warsh attends his first policy meeting as the new Fed Chair later this month.

Recession on paper: What really moves the Canadian Loonie now?

Statistics Canada handed the headline writers a gift and the analysts a headache. Real GDP shrank 0.1% on an annualized basis in the first quarter, and with the fourth quarter of 2025 revised down to a 1.0% contraction, that is two negative quarters in a row, the textbook definition of a technical recession and Canada's first since the pandemic.