|

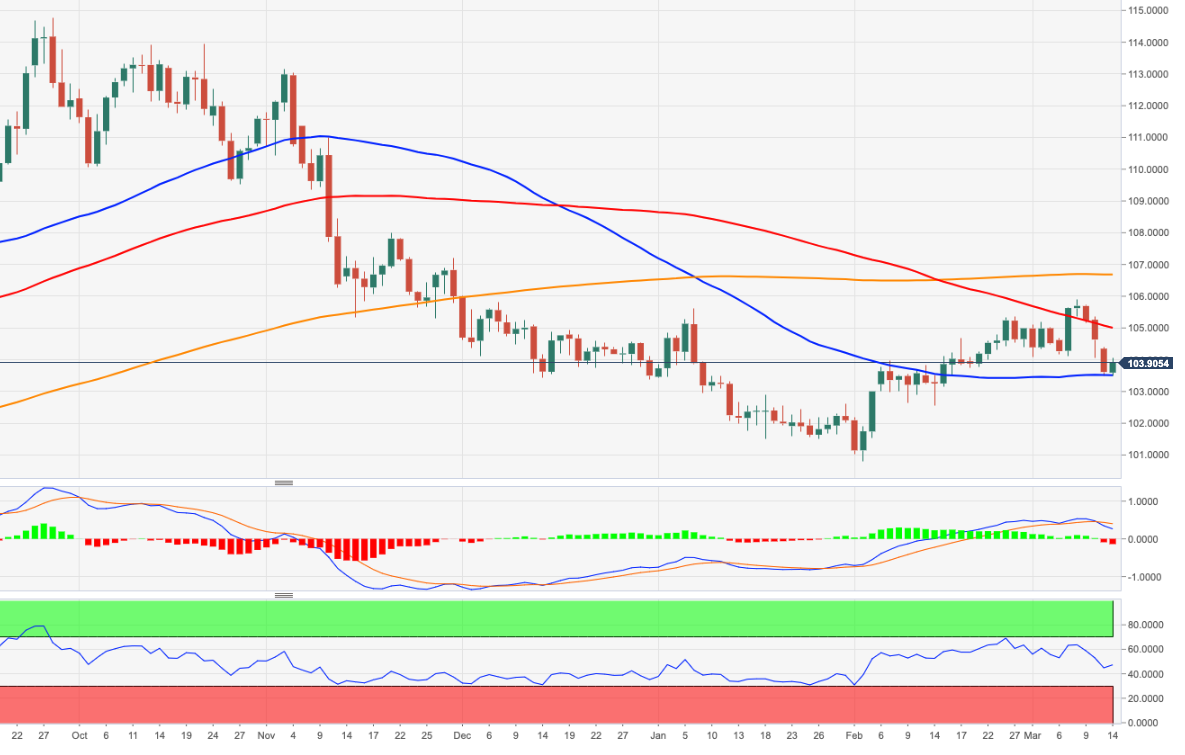
USD Index Price Analysis: Decent support remains at the 55-day SMA

  • DXY attempts a moderate recovery although it still trades below 104.00.
  • The 55-day SMA around 103.50 holds the downside so far.

DXY prints a decent rebound following Monday’s multi-week lows in the mid-103.00s.

Despite the daily bounce, the index remains under pressure and appears still supported by recent lows near 103.50, an area coincident with the provisional 55-day SMA. Below the latter, the dollar could slip back to the weekly low at 102.58 (February 14).

In the meantime, while below the 200-day SMA at 106.63, the outlook for the greenback is expected to remain negative.

DXY daily chart

Dollar Index Spot

Overview
Today last price103.92
Today Daily Change55
Today Daily Change %0.29
Today daily open103.62
 
Trends
Daily SMA20104.5
Daily SMA50103.47
Daily SMA100104.55
Daily SMA200106.84
 
Levels
Previous Daily High104.39
Previous Daily Low103.48
Previous Weekly High105.89
Previous Weekly Low104.05
Previous Monthly High105.36
Previous Monthly Low100.81
Daily Fibonacci 38.2%103.83
Daily Fibonacci 61.8%104.05
Daily Pivot Point S1103.27
Daily Pivot Point S2102.92
Daily Pivot Point S3102.36
Daily Pivot Point R1104.18
Daily Pivot Point R2104.74
Daily Pivot Point R3105.09

Author

Pablo Piovano

Born and bred in Argentina, Pablo has been carrying on with his passion for FX markets and trading since his first college years.

More from Pablo Piovano
Share:

Editor's Picks

EUR/USD remains cautious near 1.1760 ahead of US data

EUR/USD trades marginally on the defensive at the end of the week, hovering around the 1.1770-1.1760 band against the backdrop of an equally humble advance in the US Dollar. Meanwhile, investors gear up for the release of key US data later in the day, including PCE and GDP figures.

GBP/USD looks slightly bid near 1.3480, focus on US docket

The British Pound gathers some fresh steam on Friday, prompting GBP/USD to reverse four consecutive days of losses and revisit the 1.3480 zone. Cable’s decent bounce comes on the back of modest gains in the Greenback prior to the release of significant US data.

Gold extends the recovery past $5,000/oz, looks at US data

Gold prices advance for the third straight day on Friday, reaching new multi-day highs just north of the key $5,000 mark per troy ounce. The continuation of the precious metal’s uptick follows steady geopolitical effervescence in the Middle East, while traders eagerly await key US data releases.

US GDP growth expected to slow down significantly in Q4 after stellar Q3 

The United States Bureau of Economic Analysis will publish the first preliminary estimate of the fourth-quarter Gross Domestic Product at 13:30 GMT. Analysts forecast the US economy to have expanded at a 3% annualized rate, slowing down from the 4.4% growth posted in the previous quarter.

Week ahead – Markets brace for heightened volatility as event risk dominates

Dollar strength dominates markets as risk appetite remains subdued. A Supreme Court ruling, geopolitics and Fed developments are in focus. Pivotal Nvidia earnings on Wednesday as investors question tech sector weakness.

Official Trump price approaches breakout with mixed signals from traders

Official Trump (TRUMP) is trading at $3.50 at the time of writing, approaching its upper consolidation range. A breakout from this range could open the door for an upside move. On-chain data shows market indecision, with balanced flows between bulls and bears, signaling a lack of clear directional bias.