|

USD/IDR Price Analysis: Pullbacks to 10-day SMA likely amid oversold RSI conditions

  • USD/IDR struggles to decline below multi-month-old support lines.
  • Monthly top, 200-day SMA will restrict upside beyond the short-term moving average.

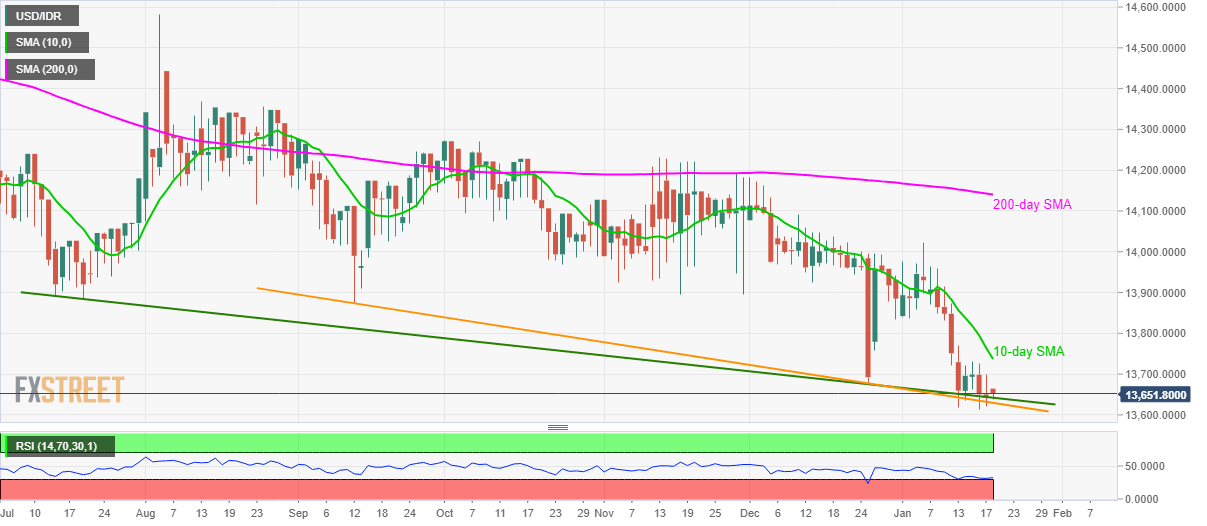
USD/IDR stays above the medium-term trend line supports while trading around 13,650 ahead of the European session on Monday. The pair has been struggling to extend its downpour below multi-month-old support-lines since December 13 wherein oversold conditions of RSI favor a pullback before further declines.

With this, a 10-day SMA level near 13,740 can please buyers during the recovery. However, the pair’s additional upside will be challenged by December 31 low near 13,835 and 14,000 round-figure.

Should prices manage to remain strong beyond 14,000, monthly top surrounding 14,025 and 200-day SMA level of 14,143 will be the key to watch.

In a case prices manage to register a daily closing below 13,630, mid-February 2018 low surrounding 13,500 cold lure the bears.

USD/IDR daily chart

Trend: Pullback expected

Additional important levels

Overview
Today last price13656.3
Today Daily Change14.3000
Today Daily Change %0.10%
Today daily open13642
 
Trends
Daily SMA2013836.3162
Daily SMA5013968.7249
Daily SMA10014032.5705
Daily SMA20014119.6192
 
Levels
Previous Daily High13698.5
Previous Daily Low13620.5375
Previous Weekly High13769.2215
Previous Weekly Low13614.5
Previous Monthly High14181.2945
Previous Monthly Low13676.9335
Daily Fibonacci 38.2%13650.3192
Daily Fibonacci 61.8%13668.7183
Daily Pivot Point S113608.8583
Daily Pivot Point S213575.7167
Daily Pivot Point S313530.8958
Daily Pivot Point R113686.8208
Daily Pivot Point R213731.6417
Daily Pivot Point R313764.7833

Author

Anil Panchal

Anil Panchal

FXStreet

Anil Panchal has nearly 15 years of experience in tracking financial markets. With a keen interest in macroeconomics, Anil aptly tracks global news/updates and stays well-informed about the global financial moves and their implications.

More from Anil Panchal
Share:

Editor's Picks

EUR/USD risks a deeper drop below 1.1750

EUR/USD keeps its vacillating mood in place as the the NA session drwas to a close on Tuesday, hovering below the 1.1800 hurdle amid acceptable gains in the US Dollar. In the meantime, market participants and the FX galaxy are expected to closely follow President Trump’s SOTU speech around 2AM GMT.
 

GBP/USD regains 1.3500 and above

GBP/USD extends its advance for the third day in a row on Tuesday, this time retesting the area beyond the 1.3500 hurdle. Cable’s uptick comes despite decent gains in the Greenback and the dovish message from the BoE’s Bailey at the UK Parliament.

Gold appears offered around $5,150

Gold is giving back a good portion of the recent multi-day rally, receding to the $5,150 zone per troy ounce amid the decent bounce in the US Dollar and mixed US Treasuty yields. In the meantime, markets’ attention remain on upcoming comments from Fed speakers.

Australia CPI to highlight persistent price pressures, backing a hawkish outlook

Australia will release its key set of inflation figures for the month of January on Wednesday, with the Consumer Price Index expected to rise by 3.7%, slightly lower than the 3.8% in the last month of 2025.

The Citrini report: How a debatable AI narrative can shake Wall Street

That AI-related headline alone was enough to rattle investors.US stocks slid sharply on Monday after a widely circulated Citrini Research memo outlined a hypothetical “2028 Global Intelligence Crisis”, warning that rapid AI adoption could push US unemployment into double digits as early as by mid-2028.

XRP pressured by weak ETF flows and declining retail interest

Ripple (XRP) is edging lower, trading above its intraday low of $1.32 at the time of writing on Tuesday. The decline from its weekly opening of $1.39 reflects heightened volatility in the broader cryptocurrency market, accentuated by tariff-triggered uncertainty.