|

USD/CNH Price Analysis: Snaps two-day downtrend around 7.1300 after China PMIs

  • USD/CNH crosses 200-HMA for the first time in two weeks after mixed China PMI data.
  • NBS Manufacturing PMI improved but Non-Manufacturing PMI and Caixin Manufacturing PMI eased in September.
  • Immediate bearish channel challenges upside momentum targeting the fresh record high.
  • MACD, RSI conditions join the key HMA breakout to favor buyers.

USD/CNH picks up bids to add gains to the first daily positive in three after China’s mixed activity data for September, published early Friday. That said, the quote renews intraday high around 7.1300 by the press time.

China’s official NBS Manufacturing PMI rose to 50.1 versus 49.6 expected and 49.4 prior while the Non-Manufacturing PMI declined to 50.6 compared to 52.0 market forecasts and 52.6 prior readings.  Further, China's Caixin Manufacturing PMI dropped to 48.1 during the stated month versus 49.5 expected and prior.

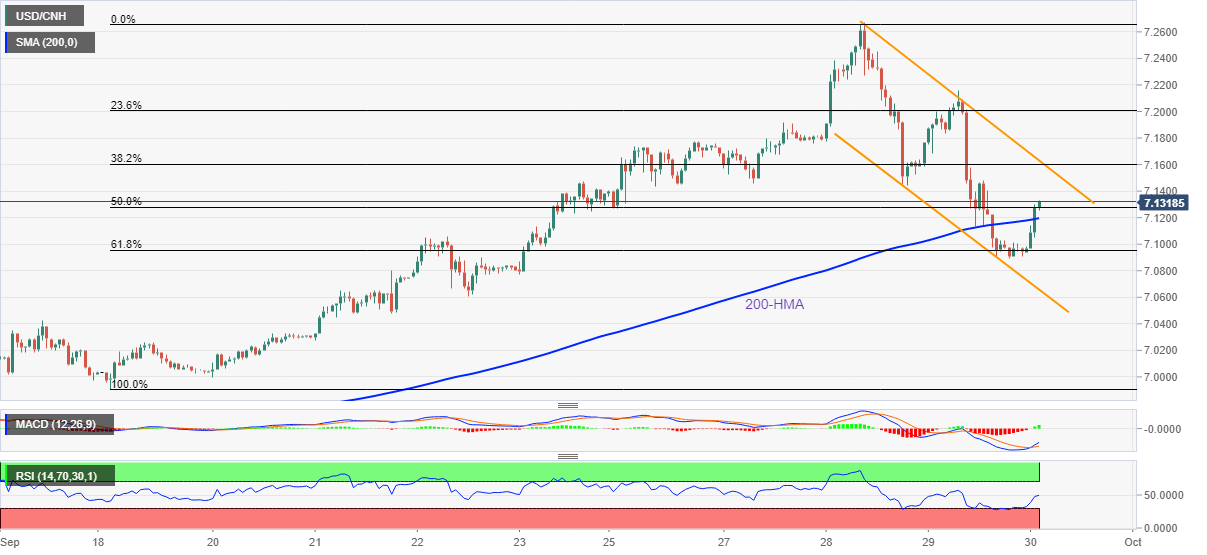
In addition to the unimpressive activity numbers but a clear rebound from the 61.8% Fibonacci retracement of the pair’s September 19-28 advances and the run-up beyond the 200-HMA for the first time in 13 days also lure USD/CNH buyers.

However, a downward sloping trend channel from Wednesday restricts immediate USD/CNH recovery, with its resistance line standing near 7.1630 by the press time.

Should the quote rises past 7.1630, the odds of witnessing a rally towards the recent record high near 7.2660 can’t be ruled out.

Alternatively, pullback moves may initially aim for the 61.8% Fibonacci retracement level, also known as the golden ratio, around 7.0950.

Following that, the stated nearby channel’s support line, close to 7.0650, could challenge the USD/CNH pair’s further weakness.

USD/CNH: Hourly chart

Trend: Further upside expected

Additional important levels

Overview
Today last price7.1294
Today Daily Change0.0324
Today Daily Change %0.46%
Today daily open7.097
 
Trends
Daily SMA207.0259
Daily SMA506.8926
Daily SMA1006.8036
Daily SMA2006.6057
 
Levels
Previous Daily High7.2158
Previous Daily Low7.0892
Previous Weekly High7.1472
Previous Weekly Low6.9904
Previous Monthly High6.9326
Previous Monthly Low6.7164
Daily Fibonacci 38.2%7.1375
Daily Fibonacci 61.8%7.1675
Daily Pivot Point S17.0522
Daily Pivot Point S27.0073
Daily Pivot Point S36.9255
Daily Pivot Point R17.1789
Daily Pivot Point R27.2607
Daily Pivot Point R37.3056

Author

Anil Panchal

Anil Panchal

FXStreet

Anil Panchal has nearly 15 years of experience in tracking financial markets. With a keen interest in macroeconomics, Anil aptly tracks global news/updates and stays well-informed about the global financial moves and their implications.

More from Anil Panchal
Share:

Markets move fast. We move first.

Orange Juice Newsletter brings you expert driven insights - not headlines. Every day on your inbox.

By subscribing you agree to our Terms and conditions.

Editor's Picks

EUR/USD moves sideways below 1.1800 on Christmas Eve

EUR/USD struggles to find direction and trades in a narrow channel below 1.1800 after posting gains for two consecutive days. Bond and stock markets in the US will open at the usual time and close early on Christmas Eve, allowing the trading action to remain subdued. 

GBP/USD keeps range around 1.3500 amid quiet markets

GBP/USD keeps its range trade intact at around 1.3500 on Wednesday. The Pound Sterling holds the upper hand over the US Dollar amid pre-Christmas light trading as traders move to the sidelines heading into the holiday season. 

Gold retreats from record highs, trades below $4,500

Gold retreats after setting a new record-high above $4,520 earlier in the day and trades in a tight range below $4,500 as trading volumes thin out ahead of the Christmas break. The US Dollar selling bias remains unabated on the back of dovish Fed expectations, which continues to act as a tailwind for the bullion amid persistent geopolitical risks.

Bitcoin slips below $87,000 as ETF outflows intensify, whale participation declines

Bitcoin price continues to trade around $86,770 on Wednesday, after failing to break above the $90,000 resistance. US-listed spot ETFs record an outflow of $188.64 million on Tuesday, marking the fourth consecutive day of withdrawals.

Economic outlook 2026-2027 in advanced countries: Solidity test

After a year marked by global economic resilience and ending on a note of optimism, 2026 looks promising and could be a year of solid economic performance. In our baseline scenario, we expect most of the supportive factors at work in 2025 to continue to play a role in 2026.

Avalanche struggles near $12 as Grayscale files updated form for ETF

Avalanche trades close to $12 by press time on Wednesday, extending the nearly 2% drop from the previous day. Grayscale filed an updated form to convert its Avalanche-focused Trust into an ETF with the US Securities and Exchange Commission.