USD/CNH Price Analysis: Refreshes four-month low on mixed China CPI/PPI
- USD/CNH remains pressured near the lowest since March 12.
- China’s CPI recovers in June but PPI remains stuck into the deflationary area.
- Sustained trading below a two-month-old support line keeps the bears hopeful.
- 61.8% Fibonacci retracement can offer a pullback amid oversold RSI.
USD/CNH remains depressed around 6.9930 following the drop to intraday low of 6.9859, also the lowest in four months, amid Thursday’s Asian session.
The pair’s earlier fall could be attributed to China’s mixed inflation numbers for June that backed the break of a downward sloping trend line from May 08. Though, oversold RSI conditions might question the quote as it is near to 61.8% Fibonacci retracement of its January-May upside.
China’s headline Consumer Price Index (CPI) YoY rose 2.5%, matching expected figures in June, whereas the monthly numbers slipped below 0.0% forecast to -0.1%. Further, the Producer Price Index (PPI) recovered from -3.2% market consensus to -3.0.
Hence, the bears are keeping the reins with an immediate target of 6.9800 mark comprising 61.8% Fibonacci retracement. However, the pair’s additional weakness remains doubtful, which if happens could drag the USD/CNH prices to February month low near 6.9570.
If at all the bears keep dominating past-6.9570, the March month’s bottom around 6.9045/50 might offer intermediate halt ahead of highlighting 6.9000 round-figures.
On the flip side, the support-turned-resistance line around 7.0000 becomes the immediate upside hurdle for the bulls to cross in order to challenge 50% Fibonacci retracement level of 7.0215.
It should, however, be noted that the buyers will remain cautious unless witnessing a daily closing beyond a 200-day SMA level of 7.0400.
USD/CNH daily chart
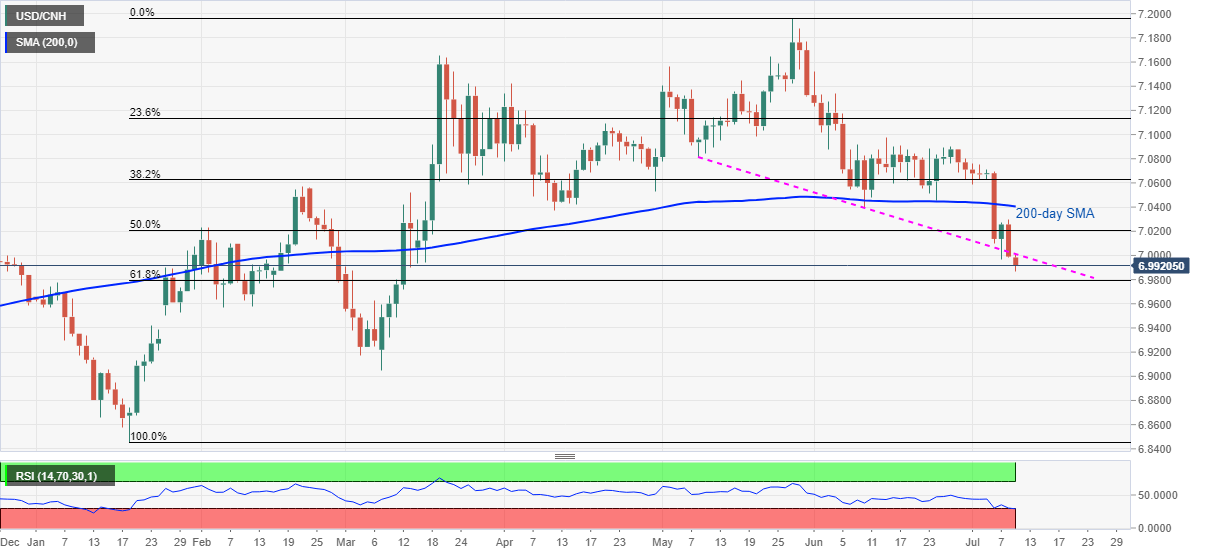
Trend: Bearish
Author

Anil Panchal
FXStreet
Anil Panchal has nearly 15 years of experience in tracking financial markets. With a keen interest in macroeconomics, Anil aptly tracks global news/updates and stays well-informed about the global financial moves and their implications.


