|

USD/CNH Price Analysis: Refreshes 16-month under 6.8000 on China data, Sino-American trade optimism

  • USD/CNH prints three-day losing streak with the largest monthly losses.
  • China extends tariff extension on US goods imports, US eases travel warnings to China, Hong Kong.
  • August month Industrial Production, Retail Sales both beat expectations.
  • Bears aim to fill May 2019 gap, fresh buying will wait for a clear break above January’s low.

USD/CNH bears an unstoppable around 0.7850, down 0.36% intraday, during the early Tuesday’s trading. The pair recently slumped after trade-positive news from China followed welcome prints of Industrial Production and Retail Sales data. While portraying the fall, the bears attack the lowest levels since May 07, 2019.

Read: S&P 500 Futures: Back on the bids as China extends tariff exemption on US goods imports

Other than the fundamentals, the pair’s sustained trading below 200-week SMA favors the sellers.

As a result, the quote drops towards filling the early May 2019 gap between 6.7339 and 6.8102.

In a case where the USD/CNH prices remain downbeat past-6.7339, 50% and 61.8% Fibonacci retracement of the pair’s 2018-19 rise, respectively around 6.7175 and 6.6035 will gain market attention.

Meanwhile, an upside clearance of a 200-week SMA level of 6.8118 will trigger recovery moves towards the January month’s low near 6.8455.

USD/CNH weekly chart
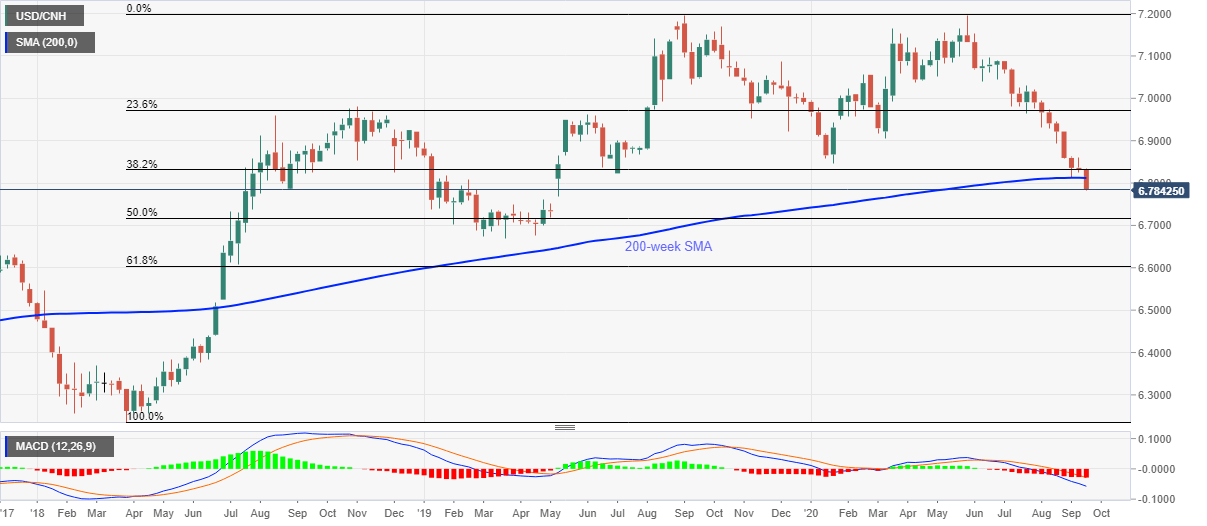
Trend: Bearish

Additional important levels

Overview
Today last price6.7848
Today Daily Change-0.0240
Today Daily Change %-0.35%
Today daily open6.8088
 
Trends
Daily SMA206.8654
Daily SMA506.9359
Daily SMA1007.0173
Daily SMA2007.0124
 
Levels
Previous Daily High6.835
Previous Daily Low6.8052
Previous Weekly High6.861
Previous Weekly Low6.8252
Previous Monthly High6.9938
Previous Monthly Low6.8436
Daily Fibonacci 38.2%6.8166
Daily Fibonacci 61.8%6.8237
Daily Pivot Point S16.7977
Daily Pivot Point S26.7866
Daily Pivot Point S36.7679
Daily Pivot Point R16.8275
Daily Pivot Point R26.8462
Daily Pivot Point R36.8573

Author

Anil Panchal

Anil Panchal

FXStreet

Anil Panchal has nearly 15 years of experience in tracking financial markets. With a keen interest in macroeconomics, Anil aptly tracks global news/updates and stays well-informed about the global financial moves and their implications.

More from Anil Panchal
Share:

Editor's Picks

EUR/USD appears supported by the 200-day SMA, for now

Following an early pullback to multi-week lows near 1.1670, EUR/USD now manages to reclaim the 1.1700 region as the NA session draws to a close on Monday. The steep retracement in spot follows the equally strong move higher in the US Dollar, as investors continue to assess the geopolitical landscape in the wake of the US and Israel attacks on Iran.


GBP/USD hits new yearly lows near 1.3300

GBP/USD adds to the recent bearish tone, approaching to the key 1.3300 support to reach fresh YTD troughs against the backdrop of the robust performance of the US Dollar. Indeed, Cable’s decline comes amid the firm demand for the safe-haven space in the wake of the US and Israel attacks to Iran.

Gold eases some ground, approaches $5,300

Gold now surrenders part of the earlier advance, reshifting its attenton to the $5,300 zone per troy ounce at the beginning of the week. Indeed, the yellow metal’s firm performance appears propped up by incresing geopolitical jitters in the Middle East, which at the same time fuels the demand for the safe-haven space.

Ethereum Price Forecast: BitMine lifts ETH holdings to 4.47M, Lee predicts geopolitical impact on markets

Ethereum (ETH) treasury firm BitMine Immersion (BMNR) bought another 50,928 ETH last week, sending its stash of the top altcoin to 4.47 million ETH worth about $8.9 billion at the time of publication.

The Fed is finally talking about AI – Here's why it matters for the US Dollar

AI is moving from earnings calls into the heart of monetary policy discussions, forcing Federal Reserve officials to confront a new question: How to act if AI reshapes inflation, employment and interest rates at the same time?

Grass 20% bullish breakout defies broader market weakness

Grass (GRASS) is edging up above $0.30 at the time of writing on Monday. The token’s notable 20% intraday surge stands out amid heightened volatility in the broader crypto market.