|

USD/CHF Technical Analysis: Symmetrical triangle on hourly chart signals return of 1.0000

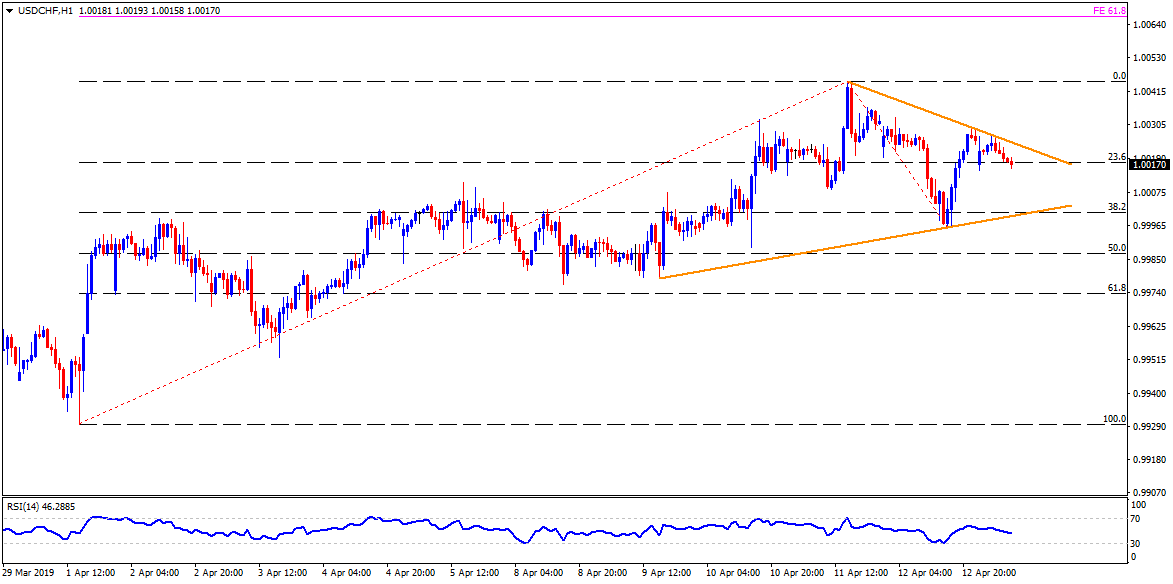
USD/CHF is trading near 1.0020 while heading into the European session on Monday. If we observe a week’s movement, the short-term symmetrical triangle can be spotted on an hourly chart.

With the quote’s recent U-turn from formation resistance, chances of its pullback to the pattern-support figure of 1.0000 seem brighter.

In doing so, 1.0010 can offer an intermediate halt to the prices.

Should there be additional downside past-1.0000, 0.9980, 0.9960 and 0.9930 can come back on the chart.

Meanwhile, an upside clearance of 1.0025 resistance-line can trigger the pair’s increase to 1.0035 and then to 1.0045.

Given the buyers manage to rule beyond 1.0045, 61.8% Fibonacci expansion (FE) of current month moves, at 1.0070, could flash on their radar to target.

USD/CHF hourly chart

Trend: Pullback expected

additional important levels

Overview
Today last price1.0019
Today Daily Change-5 pips
Today Daily Change %-0.05
Today daily open1.0024
 
Trends
Daily SMA200.9976
Daily SMA501.0009
Daily SMA1000.9961
Daily SMA2000.9926
Levels
Previous Daily High1.0037
Previous Daily Low0.9997
Previous Weekly High1.0047
Previous Weekly Low0.9977
Previous Monthly High1.0125
Previous Monthly Low0.9894
Daily Fibonacci 38.2%1.0012
Daily Fibonacci 61.8%1.0022
Daily Pivot Point S11.0002
Daily Pivot Point S20.9979
Daily Pivot Point S30.9962
Daily Pivot Point R11.0042
Daily Pivot Point R21.0059
Daily Pivot Point R31.0082

Author

Anil Panchal

Anil Panchal

FXStreet

Anil Panchal has nearly 15 years of experience in tracking financial markets. With a keen interest in macroeconomics, Anil aptly tracks global news/updates and stays well-informed about the global financial moves and their implications.

More from Anil Panchal
Share:

Editor's Picks

EUR/USD looks sidelined around 1.1850

EUR/USD remains on the back foot, extending its bearish tone and sliding towards the 1.1850 area to print fresh daily lows on Monday. The move lower comes as the US Dollar gathers modest traction, with thin liquidity and subdued volatility amplifying price swings amid the US market holiday.

GBP/USD flirts with daily lows near 1.3630

GBP/USD has quickly given back Friday’s solid gains, turning lower at the start of the week and drifting back towards the 1.3630 area. The focus now shifts squarely to Tuesday’s UK labour market report, which is likely to keep the quid firmly in the spotlight and could set the tone for Cable’s next move.

Gold battle around $5,000 continues

Gold is giving back part of Friday’s sharp rebound, deflating below the key $5,000 mark per troy ounce as the new week gets underway. Modest gains in the US Dollar are keeping the metal in check, while thin trading conditions, due to the Presidents Day holiday in the US, are adding to the choppy and hesitant tone across markets.

Bitcoin consolidates as on-chain data show mixed signals

Bitcoin price has consolidated between $65,700 and $72,000 over the past nine days, with no clear directional bias. US-listed spot ETFs recorded a $359.91 million weekly outflow, marking the fourth consecutive week of withdrawals.

The week ahead: Key inflation readings and why the AI trade could be overdone

It is likely to be a quiet start to the week, with US markets closed on Monday for Presidents Day. European markets are higher across the board and gold is clinging to the $5,000 level after the tamer than expected CPI report in the US reduced haven flows to precious metals.

XRP steadies in narrow range as fund inflows, futures interest rise

Ripple is trading in a narrow range between $1.45 (immediate support) and $1.50 (resistance) at the time of writing on Monday. The remittance token extended its recovery last week, peaking at $1.67 on Sunday from the weekly open at $1.43.