|

USD/CHF Technical Analysis: 0.9950 bear target hit as the Greenback is en route towards 0.9880 against CHF
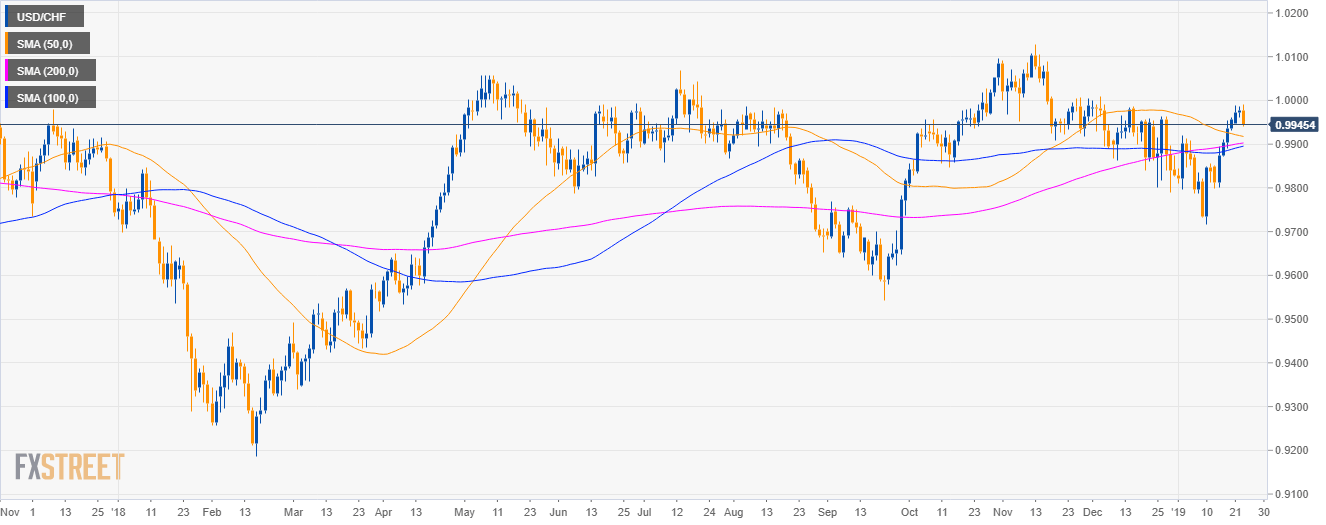
USD/CHF daily chart 

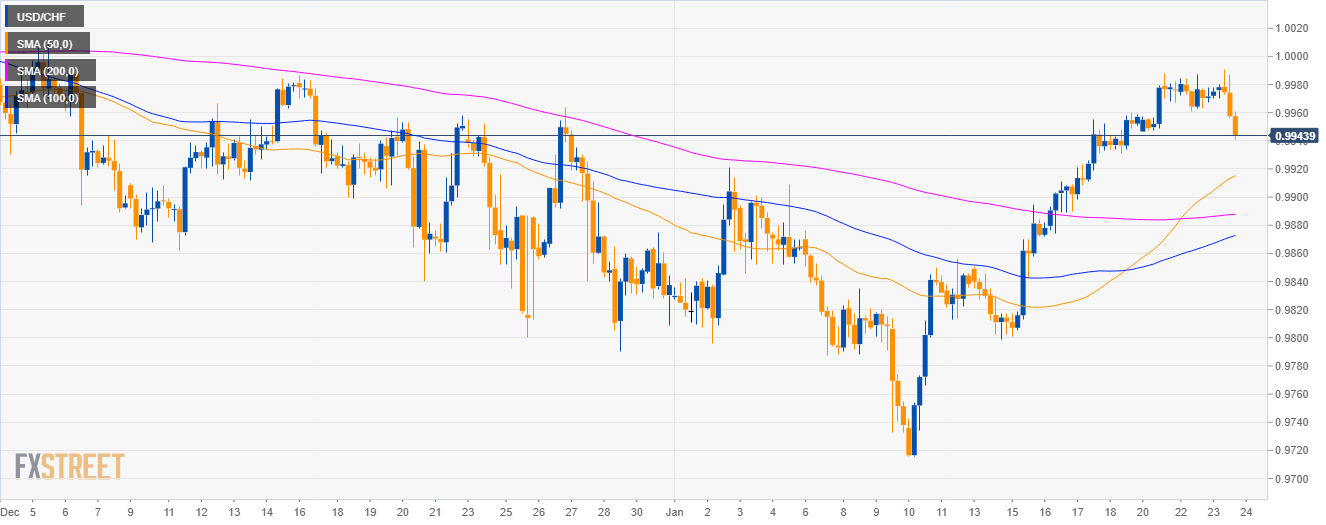
USD/CHF 4-hour chart

  • USD/CHF is trading above the main SMAs as the market is rejecting the parity level.

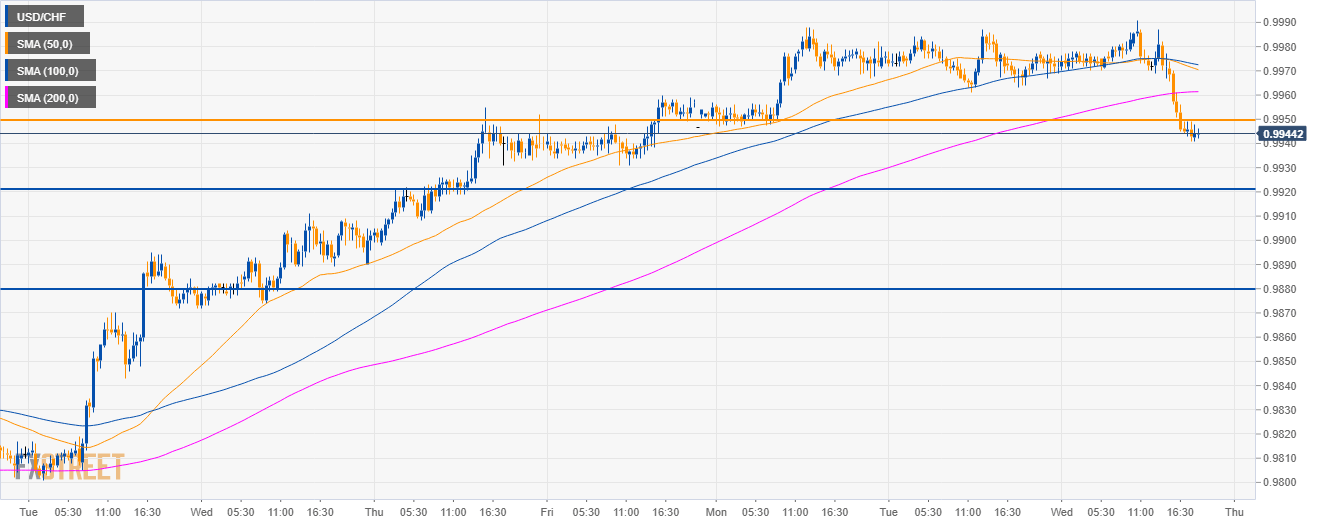
USD/CHF 30-minute chart

  • As bears broke below the 0.9950 level and the 200 SMA the next targets become 0.9920 and 0.9880 to the downside. 
  • The 0.9950 level become resistance.

Additional key levels

USD/CHF

Overview:
    Today Last Price: 0.9944
    Today Daily change: -32 pips
    Today Daily change %: -0.32%
    Today Daily Open: 0.9976
Trends:
    Daily SMA20: 0.9871
    Daily SMA50: 0.992
    Daily SMA100: 0.9893
    Daily SMA200: 0.99
Levels:
    Previous Daily High: 0.9987
    Previous Daily Low: 0.9961
    Previous Weekly High: 0.996
    Previous Weekly Low: 0.9799
    Previous Monthly High: 1.0009
    Previous Monthly Low: 0.979
    Daily Fibonacci 38.2%: 0.9977
    Daily Fibonacci 61.8%: 0.9971
    Daily Pivot Point S1: 0.9962
    Daily Pivot Point S2: 0.9949
    Daily Pivot Point S3: 0.9936
    Daily Pivot Point R1: 0.9988
    Daily Pivot Point R2: 1.0001
    Daily Pivot Point R3: 1.0014

Author

Flavio Tosti

Flavio Tosti

Independent Analyst


More from Flavio Tosti
Share:

Editor's Picks

EUR/USD risks a deeper drop below 1.1750

EUR/USD keeps its vacillating mood in place as the the NA session drwas to a close on Tuesday, hovering below the 1.1800 hurdle amid acceptable gains in the US Dollar. In the meantime, market participants and the FX galaxy are expected to closely follow President Trump’s SOTU speech around 2AM GMT.
 

GBP/USD regains 1.3500 and above

GBP/USD extends its advance for the third day in a row on Tuesday, this time retesting the area beyond the 1.3500 hurdle. Cable’s uptick comes despite decent gains in the Greenback and the dovish message from the BoE’s Bailey at the UK Parliament.

Gold appears offered around $5,150

Gold is giving back a good portion of the recent multi-day rally, receding to the $5,150 zone per troy ounce amid the decent bounce in the US Dollar and mixed US Treasuty yields. In the meantime, markets’ attention remain on upcoming comments from Fed speakers.

Ripple’s DeFi shift in focus: Navigating XRPL EVM sidechain growth, XRPFi migration and liquidity
Ripple (XRP) has continued to trade under pressure, extending its decline by approximately 63% from the record high of $3.66 in July. The remittance token is trading above support at $1.35, while its upside appears limited by key supply zones, starting with $1.40, at the time of writing on Tuesday.
The Citrini report: How a debatable AI narrative can shake Wall Street

That AI-related headline alone was enough to rattle investors.US stocks slid sharply on Monday after a widely circulated Citrini Research memo outlined a hypothetical “2028 Global Intelligence Crisis”, warning that rapid AI adoption could push US unemployment into double digits as early as by mid-2028.

XRP pressured by weak ETF flows and declining retail interest

Ripple (XRP) is edging lower, trading above its intraday low of $1.32 at the time of writing on Tuesday. The decline from its weekly opening of $1.39 reflects heightened volatility in the broader cryptocurrency market, accentuated by tariff-triggered uncertainty.