GBP/JPY Price Forecast: Jumps as PM Takaichi flags BoJ hike concerns
- GBP/JPY surges as Sanae Takaichi questions pace of hikes by Kazuo Ueda.
- Technical bias remains bullish after rebound from 100-day SMA near 207.60.
- Break above 211.00 opens path toward 214.44, though intervention risks may cap gains.

The Pound Sterling advances versus the Japanese Yen, in the aftermath of comments that the Japanese PM Takaichi expressed her concerns about additional rate hikes to Bank of Japan Governor Kazuo Ueda, as the central bank seems poised to resume its normalization of monetary policy. At the time of writing, the GBP/JPY trades at 210.34, posting gains of over 0.80%.
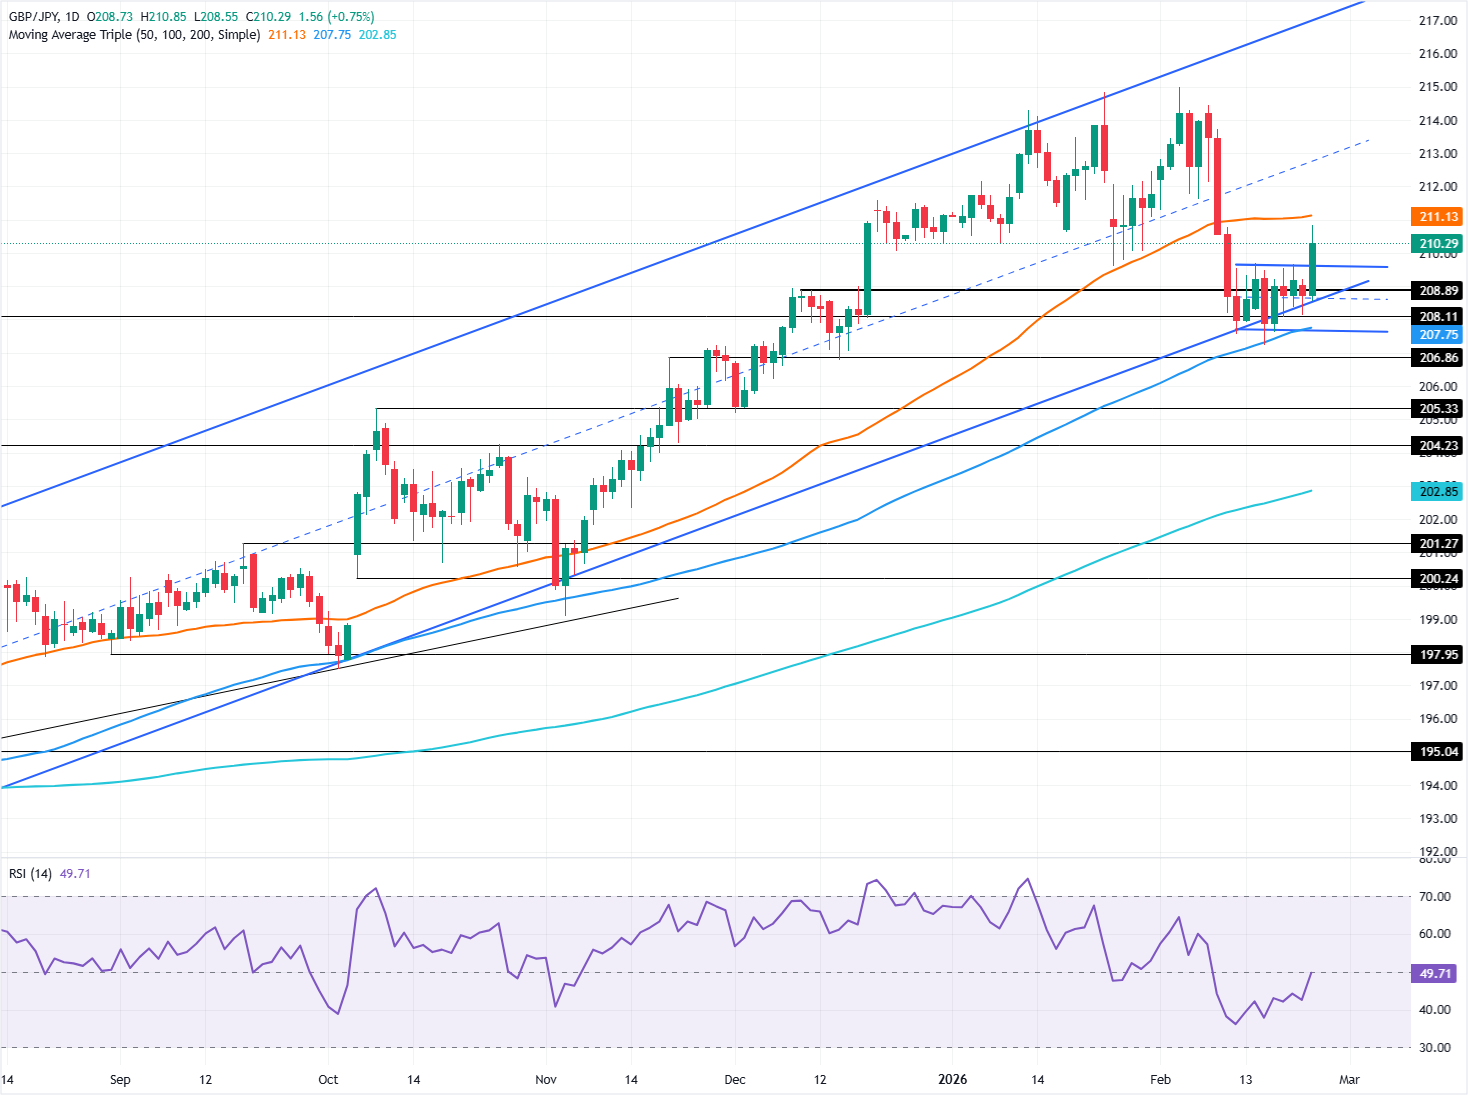
GBP/JPY Price Forecast: Technical outlook
The GBP/JPY technical picture shows the cross remains upward biased after finding support at the confluence of the 100-day SMA and a support trendline at around 207.62, clearing the 208.00 figure, extending its gains of over 160 pips.
Momentum as depicted by the Relative Strength Index (RSI) is about to turn bullish, but fears of a possible intervention in the FX markets by the BoJ or Japanese authorities, can cap the cross-pair advance.
Immediate resistance is pegged at the 210.50 area, followed by the 50-day SMA past the 211.00 figure at 211.02. A breach of the latte r clears the way to challenge the next key swing high at 214.44, the February 9 high.
On the downside, support is seen at the February 16 high turned support at 209.68, followed by the February 23 daily low of 208.14. Should the 208.00 figure gives way and the focus shifts towards the 100-day SMA.
GBP/JPY Price Chart – Daily
Japanese Yen Price This week
The table below shows the percentage change of Japanese Yen (JPY) against listed major currencies this week. Japanese Yen was the strongest against the Australian Dollar.
| USD | EUR | GBP | JPY | CAD | AUD | NZD | CHF | |
|---|---|---|---|---|---|---|---|---|
| USD | 0.20% | -0.04% | 0.59% | 0.20% | 0.33% | 0.36% | -0.04% | |
| EUR | -0.20% | -0.19% | 0.40% | 0.03% | 0.12% | 0.17% | -0.15% | |
| GBP | 0.04% | 0.19% | 0.78% | 0.20% | 0.29% | 0.36% | -0.02% | |
| JPY | -0.59% | -0.40% | -0.78% | -0.40% | -0.22% | -0.27% | -0.68% | |
| CAD | -0.20% | -0.03% | -0.20% | 0.40% | 0.17% | 0.12% | -0.26% | |
| AUD | -0.33% | -0.12% | -0.29% | 0.22% | -0.17% | 0.04% | -0.37% | |
| NZD | -0.36% | -0.17% | -0.36% | 0.27% | -0.12% | -0.04% | -0.38% | |
| CHF | 0.04% | 0.15% | 0.02% | 0.68% | 0.26% | 0.37% | 0.38% |
The heat map shows percentage changes of major currencies against each other. The base currency is picked from the left column, while the quote currency is picked from the top row. For example, if you pick the Japanese Yen from the left column and move along the horizontal line to the US Dollar, the percentage change displayed in the box will represent JPY (base)/USD (quote).
Author

Christian Borjon Valencia
FXStreet
Markets analyst, news editor, and trading instructor with over 14 years of experience across FX, commodities, US equity indices, and global macro markets.


