USD/CHF Price Forecast: At make or a break around 0.8340
- USD/CHF flattens near 0.8340 as the US Dollar bounces back.
- Moody’s downgraded the US Sovereign Credit rating to Aa1 from Aaa.
- The SNB opened doors to negative interest rates amid global economic uncertainty.
The USD/CHF pair flattens around 0.8340 during North American trading hours on Tuesday after clawing back initial losses. The Swiss Franc pair rebounds as the US Dollar Index (DXY) bounced back after attracting bids near the weekly low around 100.00.
Earlier in the day, the US Dollar traded lower as Moody’s downgraded the United States (US) Sovereign Credit Rating due to mounting debt concerns. Additionally, fresh concerns over de-escalation in the US-China trade war had also weighed on the US Dollar. Beijing condemns Washington for discouraging the use of Huawei-made Artificial Intelligence (AI) chips and Chinese AI models, highlighting them as a threat to US export controls.
Domestically, investors await the flash S& Global Purchasing Managers’ Index (PMI) data for May, which will be released on Thursday. The PMI report is expected to show that the overall business activity grew at a steady pace.
Meanwhile, the Swiss Franc (CHF) trades higher against its major peers, but is expected to be driven by market expectations for the Swiss National Bank’s (SNB) monetary policy outlook. SNB Chairman Martin Schlegel has signaled that the central bank is ready to consider negative interest rates to battle against global economic risks.
Swiss Franc PRICE Today
The table below shows the percentage change of Swiss Franc (CHF) against listed major currencies today. Swiss Franc was the strongest against the Australian Dollar.
| USD | EUR | GBP | JPY | CAD | AUD | NZD | CHF | |
|---|---|---|---|---|---|---|---|---|
| USD | 0.03% | 0.09% | 0.07% | -0.15% | 0.91% | 0.48% | -0.09% | |
| EUR | -0.03% | 0.07% | 0.03% | -0.18% | 0.89% | 0.47% | -0.12% | |
| GBP | -0.09% | -0.07% | -0.04% | -0.25% | 0.79% | 0.42% | -0.15% | |
| JPY | -0.07% | -0.03% | 0.04% | -0.23% | 0.83% | 0.40% | -0.12% | |
| CAD | 0.15% | 0.18% | 0.25% | 0.23% | 1.07% | 0.64% | 0.10% | |
| AUD | -0.91% | -0.89% | -0.79% | -0.83% | -1.07% | -0.42% | -0.96% | |
| NZD | -0.48% | -0.47% | -0.42% | -0.40% | -0.64% | 0.42% | -0.54% | |
| CHF | 0.09% | 0.12% | 0.15% | 0.12% | -0.10% | 0.96% | 0.54% |
The heat map shows percentage changes of major currencies against each other. The base currency is picked from the left column, while the quote currency is picked from the top row. For example, if you pick the Swiss Franc from the left column and move along the horizontal line to the US Dollar, the percentage change displayed in the box will represent CHF (base)/USD (quote).
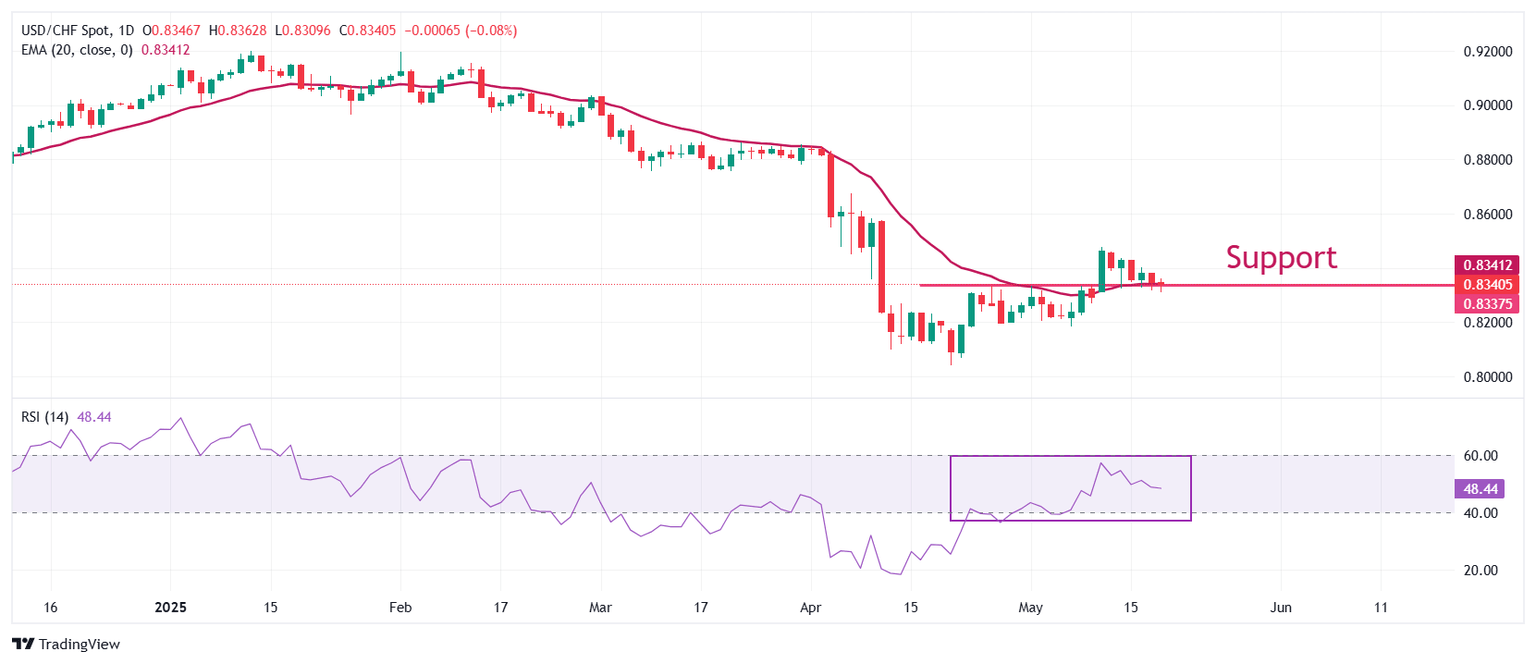
USD/CHF gauges cushion near the horizontal support plotted from the April 25 low of 0.8335, which used to be a major resistance for the pair. The asset wobbles around the 20-day Exponential Moving Average (EMA), which trades around 0.8340, indicating a sideways trend.
The 14-day Relative Strength Index (RSI) oscillates inside the 40.00-60.00, suggesting a volatility contraction.
A fresh upside move in the pair towards the April 10 high of 0.8580 and the April 8 high of 0.8611 would appear if it breaks above the psychological level of 0.8500.
On the flip side, a downside move below the May 7 low of 0.8186 would drag the asset towards the April 11 low of 0.8100, followed by the April 21 low of 0.8040.
USD/CHF daily chart
US Dollar FAQs
The US Dollar (USD) is the official currency of the United States of America, and the ‘de facto’ currency of a significant number of other countries where it is found in circulation alongside local notes. It is the most heavily traded currency in the world, accounting for over 88% of all global foreign exchange turnover, or an average of $6.6 trillion in transactions per day, according to data from 2022. Following the second world war, the USD took over from the British Pound as the world’s reserve currency. For most of its history, the US Dollar was backed by Gold, until the Bretton Woods Agreement in 1971 when the Gold Standard went away.
The most important single factor impacting on the value of the US Dollar is monetary policy, which is shaped by the Federal Reserve (Fed). The Fed has two mandates: to achieve price stability (control inflation) and foster full employment. Its primary tool to achieve these two goals is by adjusting interest rates. When prices are rising too quickly and inflation is above the Fed’s 2% target, the Fed will raise rates, which helps the USD value. When inflation falls below 2% or the Unemployment Rate is too high, the Fed may lower interest rates, which weighs on the Greenback.
In extreme situations, the Federal Reserve can also print more Dollars and enact quantitative easing (QE). QE is the process by which the Fed substantially increases the flow of credit in a stuck financial system. It is a non-standard policy measure used when credit has dried up because banks will not lend to each other (out of the fear of counterparty default). It is a last resort when simply lowering interest rates is unlikely to achieve the necessary result. It was the Fed’s weapon of choice to combat the credit crunch that occurred during the Great Financial Crisis in 2008. It involves the Fed printing more Dollars and using them to buy US government bonds predominantly from financial institutions. QE usually leads to a weaker US Dollar.
Quantitative tightening (QT) is the reverse process whereby the Federal Reserve stops buying bonds from financial institutions and does not reinvest the principal from the bonds it holds maturing in new purchases. It is usually positive for the US Dollar.
Author

Sagar Dua
FXStreet
Sagar Dua is associated with the financial markets from his college days. Along with pursuing post-graduation in Commerce in 2014, he started his markets training with chart analysis.


