• USD/CHF advances sharply, eyeing a break of the 200-hour EMA, which could expose parity.
  • During the last two days, the USD/CHF has advanced more than 1% after bouncing from the weekly lows of around 0.9841.
  • Further upside is expected as November’s Fed meeting looms.

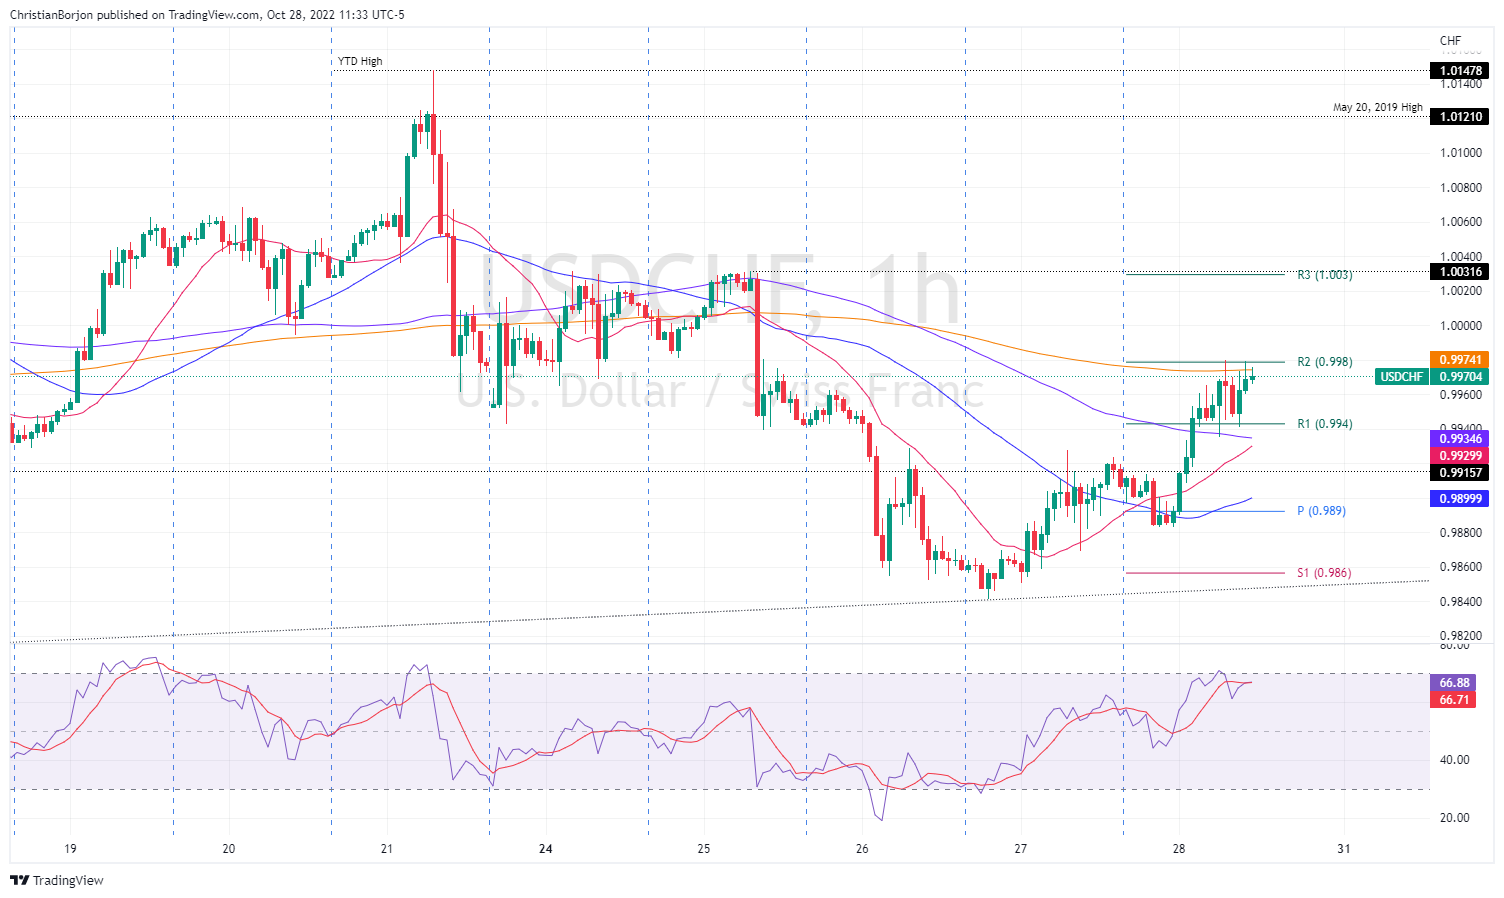
The USD/CHF is gaining some traction in the North American session, surpassing the 20-day Exponential Moving Averages (EMA) at 0.9949, courtesy of positive fundamental data, opening the door for a re-test of parity ahead into the weekend. At the time of writing, the USD/CHF is trading at 0.9970, above its opening price by 0.63%.

USD/CHF Price Analysis: Technical outlook

From a technical perspective, the USD/CHF remains upward biased following the pullback from the YTD high at 1.0147 towards October’s 27 low at 0.9841 due to sellers failing to extend the USD/CHF losses below the 50-day EMA at 0.9809, which, could have exacerbated a fall towards the 100-day EMA at 0.9722. Instead, buyers stepped in, reclaimed the 20-day EMA, and are posing a threat of finishing the week above parity for back-to-back weeks. If that scenario plays out, the USD/CHF would be under upward pressure, and with the Federal Reserve’s meeting looming, a challenge of the YTD high could be on the cards.

Short term, the USD/CHF 1-hour chart depicts buyers are testing the 200-hour EMA at the confluence of the R1 daily pivot at 0.9980, which, if broken, could open the door to test the October 25 high and the R3 daily pivot level at 1.0031. It should be noted that the Relative Strength Index (RSI) is still in bullish territory, so buyers have some room to spare. On the downside, the R1 daily pivot at 0.9940 could cap any losses if the CHF strengthens at a specific time of the New York session, which is unlikely to happen as traders brace for the weekend. If it happens, then the confluence of the 100 and the 20-hour EMAs, around 0.9934/30, would be difficult to surpass, ahead of the 0.9900 figure.

USD/CHF Key Technical Levels

USD/CHF

Overview
Today last price 0.9973
Today Daily Change 0.0060
Today Daily Change % 0.61
Today daily open 0.9913
 
Trends
Daily SMA20 0.9949
Daily SMA50 0.9806
Daily SMA100 0.9727
Daily SMA200 0.9587
 
Levels
Previous Daily High 0.9928
Previous Daily Low 0.9842
Previous Weekly High 1.0148
Previous Weekly Low 0.9919
Previous Monthly High 0.9966
Previous Monthly Low 0.948
Daily Fibonacci 38.2% 0.9895
Daily Fibonacci 61.8% 0.9875
Daily Pivot Point S1 0.986
Daily Pivot Point S2 0.9808
Daily Pivot Point S3 0.9774
Daily Pivot Point R1 0.9947
Daily Pivot Point R2 0.998
Daily Pivot Point R3 1.0033


Share: Feed news

Information on these pages contains forward-looking statements that involve risks and uncertainties. Markets and instruments profiled on this page are for informational purposes only and should not in any way come across as a recommendation to buy or sell in these assets. You should do your own thorough research before making any investment decisions. FXStreet does not in any way guarantee that this information is free from mistakes, errors, or material misstatements. It also does not guarantee that this information is of a timely nature. Investing in Open Markets involves a great deal of risk, including the loss of all or a portion of your investment, as well as emotional distress. All risks, losses and costs associated with investing, including total loss of principal, are your responsibility. The views and opinions expressed in this article are those of the authors and do not necessarily reflect the official policy or position of FXStreet nor its advertisers. The author will not be held responsible for information that is found at the end of links posted on this page.

If not otherwise explicitly mentioned in the body of the article, at the time of writing, the author has no position in any stock mentioned in this article and no business relationship with any company mentioned. The author has not received compensation for writing this article, other than from FXStreet.

FXStreet and the author do not provide personalized recommendations. The author makes no representations as to the accuracy, completeness, or suitability of this information. FXStreet and the author will not be liable for any errors, omissions or any losses, injuries or damages arising from this information and its display or use. Errors and omissions excepted.

The author and FXStreet are not registered investment advisors and nothing in this article is intended to be investment advice.

Recommended content


Recommended content

Editors’ Picks

EUR/USD regains traction, recovers above 1.0700

EUR/USD regains traction, recovers above 1.0700

EUR/USD regained its traction and turned positive on the day above 1.0700 in the American session. The US Dollar struggles to preserve its strength after the data from the US showed that the economy grew at a softer pace than expected in Q1.

EUR/USD News

GBP/USD returns to 1.2500 area in volatile session

GBP/USD returns to 1.2500 area in volatile session

GBP/USD reversed its direction and recovered to 1.2500 after falling to the 1.2450 area earlier in the day. Although markets remain risk-averse, the US Dollar struggles to find demand following the disappointing GDP data.

GBP/USD News

Gold holds around $2,330 after dismal US data

Gold holds around $2,330 after dismal US data

Gold fell below $2,320 in the early American session as US yields shot higher after the data showed a significant increase in the US GDP price deflator in Q1. With safe-haven flows dominating the markets, however, XAU/USD reversed its direction and rose above $2,340.

Gold News

XRP extends its decline, crypto experts comment on Ripple stablecoin and benefits for XRP Ledger

XRP extends its decline, crypto experts comment on Ripple stablecoin and benefits for XRP Ledger

Ripple extends decline to $0.52 on Thursday, wipes out weekly gains. Crypto expert asks Ripple CTO how the stablecoin will benefit the XRP Ledger and native token XRP. 

Read more

After the US close, it’s the Tokyo CPI

After the US close, it’s the Tokyo CPI

After the US close, it’s the Tokyo CPI, a reliable indicator of the national number and then the BoJ policy announcement. Tokyo CPI ex food and energy in Japan was a rise to 2.90% in March from 2.50%.

Read more

Forex MAJORS

Cryptocurrencies

Signatures