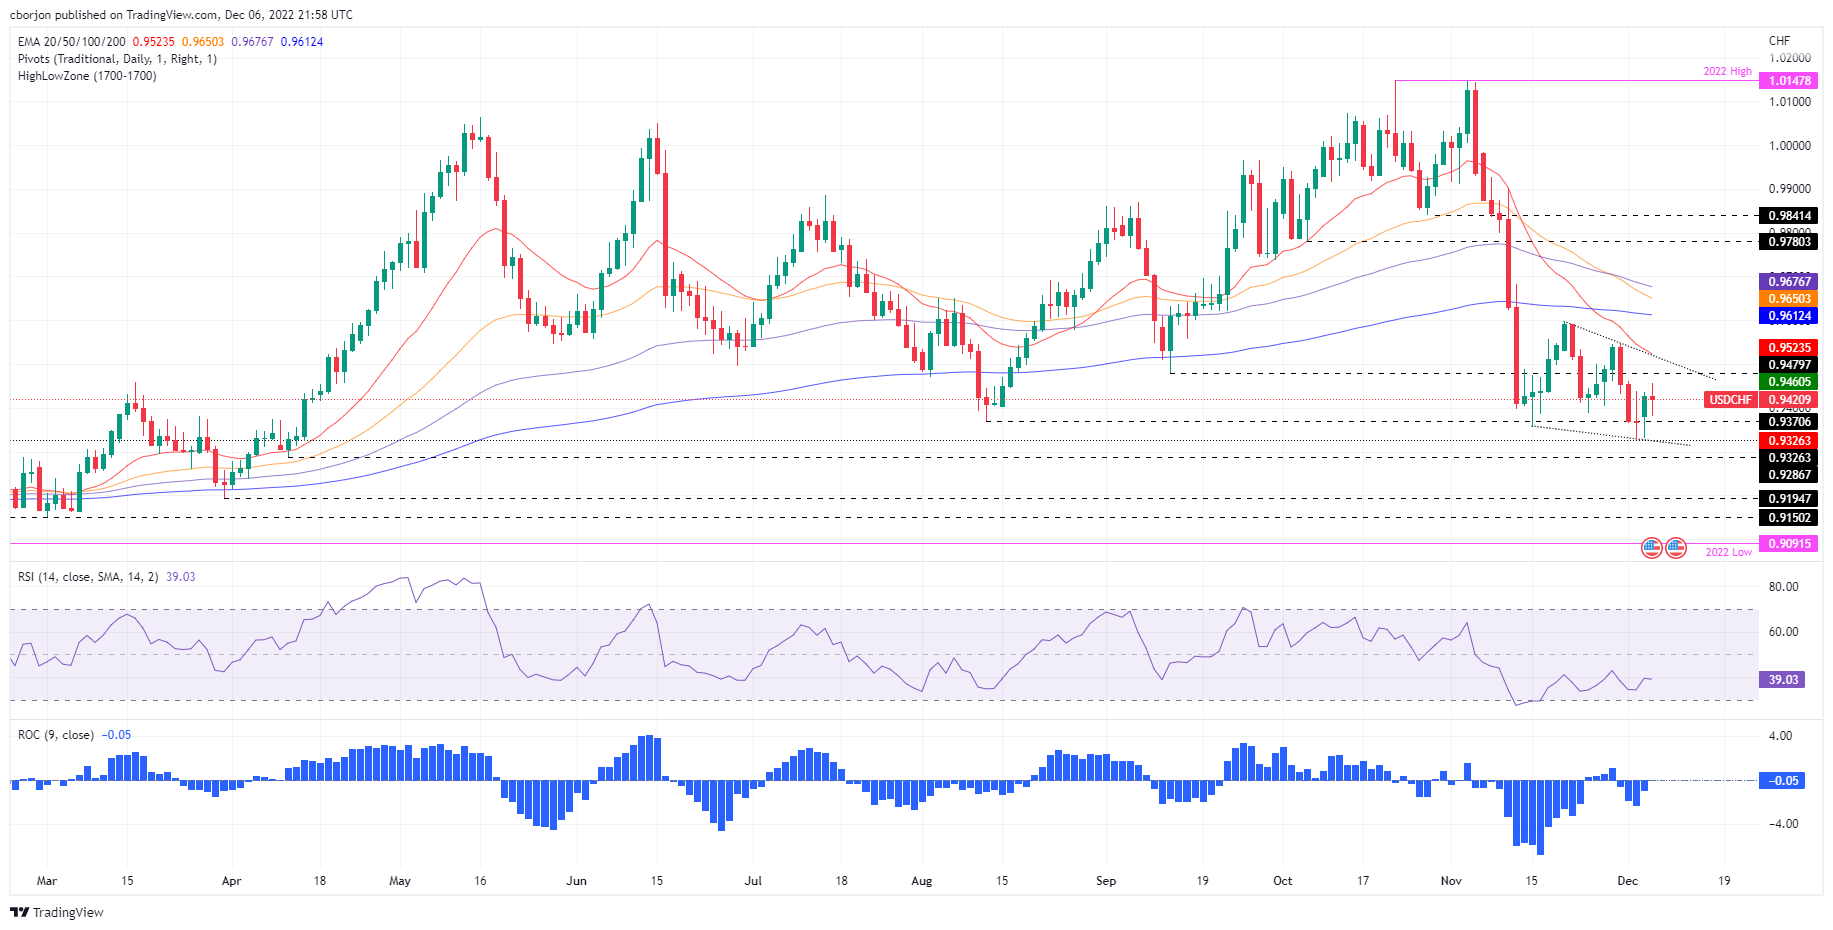
• USD/CHF consolidates around 0.9380-9450s amidst the lack of a catalyst.
  • USD/CHF Price Analysis: Break above the 200-EMA could pave the way towards 0.9550.

The USD/CHF hit a fresh three-day high at 0.9455 but shifted downwards as US Treasury bond yields weakened the US Dollar (USD) against the Swiss Franc (CHF). At the time of writing, the USD/CHF is trading at 0.9419., below its opening price by a minuscule 0.07%.

USD/CHF Price Analysis: Technical outlook

From a daily chart perspective, the USD/CHF is downward biased, though it’s forming a falling wedge that suggests prices would break to the upside. Of note, the USD/CHF registered a new 8-month low of around 0.9326 last Friday, and so far, the USD/CHF has remained subdued around 0.9320-0.9455.

Oscillators like the Relative Strength Index (RSI) is almost flat at bearish territory, while the Rate of Change (RoC) suggests that selling pressure is fading. If the USD/CHF breaks above 0.9455, that could open the door toward 0.9500.

Short term, the USD/CHF 1-hour chart depicts the pair as neutral-upward biased. The EMAs are almost flat, around the spot price, though the 200-EMA at 0.9436 has been acting as solid resistance as prices tumbled around that area. Break above the latter could open the door towards the 0.9500 figure, followed by the November 30 daily high at 0.9547. As an alternate scenario, the USD/CHF first support would be the intersection of the 20 and 50-EMAs around 0.9411-13, followed by the 100- EMA at 0.9405 and the 0.9400 mark.

USD/CHF

Overview
Today last price 0.9419
Today Daily Change -0.0015
Today Daily Change % -0.16
Today daily open 0.9434
 
Trends
Daily SMA20 0.9512
Daily SMA50 0.9772
Daily SMA100 0.9704
Daily SMA200 0.9643
 
Levels
Previous Daily High 0.9435
Previous Daily Low 0.933
Previous Weekly High 0.9548
Previous Weekly Low 0.9326
Previous Monthly High 1.0148
Previous Monthly Low 0.9357
Daily Fibonacci 38.2% 0.9395
Daily Fibonacci 61.8% 0.937
Daily Pivot Point S1 0.9365
Daily Pivot Point S2 0.9296
Daily Pivot Point S3 0.9261
Daily Pivot Point R1 0.9469
Daily Pivot Point R2 0.9504
Daily Pivot Point R3 0.9573


Share: Feed news

Information on these pages contains forward-looking statements that involve risks and uncertainties. Markets and instruments profiled on this page are for informational purposes only and should not in any way come across as a recommendation to buy or sell in these assets. You should do your own thorough research before making any investment decisions. FXStreet does not in any way guarantee that this information is free from mistakes, errors, or material misstatements. It also does not guarantee that this information is of a timely nature. Investing in Open Markets involves a great deal of risk, including the loss of all or a portion of your investment, as well as emotional distress. All risks, losses and costs associated with investing, including total loss of principal, are your responsibility. The views and opinions expressed in this article are those of the authors and do not necessarily reflect the official policy or position of FXStreet nor its advertisers. The author will not be held responsible for information that is found at the end of links posted on this page.

If not otherwise explicitly mentioned in the body of the article, at the time of writing, the author has no position in any stock mentioned in this article and no business relationship with any company mentioned. The author has not received compensation for writing this article, other than from FXStreet.

FXStreet and the author do not provide personalized recommendations. The author makes no representations as to the accuracy, completeness, or suitability of this information. FXStreet and the author will not be liable for any errors, omissions or any losses, injuries or damages arising from this information and its display or use. Errors and omissions excepted.

The author and FXStreet are not registered investment advisors and nothing in this article is intended to be investment advice.

Recommended content


Recommended content

Editors’ Picks

GBP/USD stays weak near 1.2400 after UK Retail Sales data

GBP/USD stays weak near 1.2400 after UK Retail Sales data

GBP/USD stays vulnerable near 1.2400 early Friday, sitting at five-month troughs. The UK Retail Sales data came in mixed and added to the weakness in the pair. Risk-aversion on the Middle East escalation keeps the pair on the back foot. 

GBP/USD News

EUR/USD extends its downside below 1.0650 on hawkish Fed remarks

EUR/USD extends its downside below 1.0650 on hawkish Fed remarks

The EUR/USD extends its downside around 1.0640 after retreating from weekly peaks of 1.0690 on Friday. The hawkish comments from Federal Reserve officials provide some support to the US Dollar.

EUR/USD News

Gold: Middle East war fears spark fresh XAU/USD rally, will it sustain?

Gold: Middle East war fears spark fresh XAU/USD rally, will it sustain?

Gold price is trading close to $2,400 early Friday, reversing from a fresh five-day high reached at $2,418 earlier in the Asian session. Despite the pullback, Gold price remains on track to book the fifth weekly gain in a row.

Gold News

Bitcoin Price Outlook: All eyes on BTC as CNN calls halving the ‘World Cup for Bitcoin’

Bitcoin Price Outlook: All eyes on BTC as CNN calls halving the ‘World Cup for Bitcoin’

Bitcoin price remains the focus of traders and investors ahead of the halving, which is an important event expected to kick off the next bull market. Amid conflicting forecasts from analysts, an international media site has lauded the halving and what it means for the industry.   

Read more

Israel vs. Iran: Fear of escalation grips risk markets

Israel vs. Iran: Fear of escalation grips risk markets

Recent reports of an Israeli aerial bombardment targeting a key nuclear facility in central Isfahan have sparked a significant shift out of risk assets and into safe-haven investments. 

Read more

Forex MAJORS

Cryptocurrencies

Signatures