|

USD/CHF Price Analysis: Snaps two-day winning streak, pullback from 0.9000 appears elusive

  • USD/CHF pares weekly gains amid pre-data anxiety, stays above the key support lines.
  • 200-SMA, monthly resistance line challenge buyers even as MACD prints bullish signals.
  • Sellers need validation from 0.8900 to retake control.
  • Swiss Real Retail Sales, US Core PCE Price Index eyed for clear directions.

USD/CHF takes offers to refresh intraday low near 0.8980 as it consolidates the weekly gains, the second one in a row, heading into Friday’s European session. In doing so, the Swiss Franc (CHF) pair portrays the market’s positioning for the Swiss Real Retail Sales for May and US Core Personal Consumption Expenditure (PCE) Price Index for May, also known as the Federal Reserve’s (Fed) favorite inflation gauge.

Also read: USD/CHF seesaws near 0.9000 ahead of Swiss Retail Sales, Fed’s favorite inflation clues

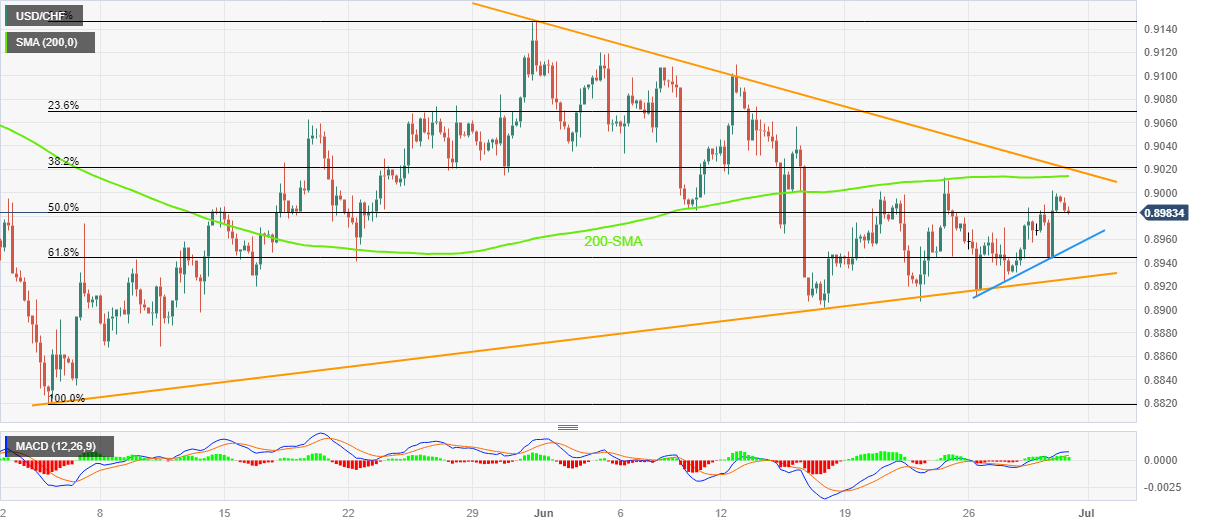
It’s worth noting, however, that the USD/CHF pair’s latest retreat appears elusive as the MACD flashes the bullish signals and the price is well above the key support lines.

Hence, the bears remain cautious unless witnessing a clear downside break of the eight-week-old rising support line, close to 0.8925.

Ahead of that, the weekly support line and the 61.8% Fibonacci retracement of its May-June upside, respectively near 0.8950 and 0.8945, can test the USD/CHF bears.

In a case where the pair remains bearish past 0.8925, the odds witnessing a quick slump to the monthly low surrounding the 0.8900 round figure and then to the yearly low marked in May around 0.8820 can’t be ruled out.

Alternatively, the 200-SMA level of around 0.9015 precedes a downward-sloping trend line from May 31, close to 0.9020 at the latest, to restrict short-term upside of the USD/CHF pair.

USD/CHF: Four-hour chart
Trend: limited downside expected

Additional important levels

Overview
Today last price0.8983
Today Daily Change-0.0011
Today Daily Change %-0.12%
Today daily open0.8994
 
Trends
Daily SMA200.9001
Daily SMA500.898
Daily SMA1000.9088
Daily SMA2000.9309
 
Levels
Previous Daily High0.9002
Previous Daily Low0.8944
Previous Weekly High0.9013
Previous Weekly Low0.8907
Previous Monthly High0.9148
Previous Monthly Low0.882
Daily Fibonacci 38.2%0.898
Daily Fibonacci 61.8%0.8966
Daily Pivot Point S10.8957
Daily Pivot Point S20.8921
Daily Pivot Point S30.8899
Daily Pivot Point R10.9016
Daily Pivot Point R20.9038
Daily Pivot Point R30.9074

Author

Anil Panchal

Anil Panchal

FXStreet

Anil Panchal has nearly 15 years of experience in tracking financial markets. With a keen interest in macroeconomics, Anil aptly tracks global news/updates and stays well-informed about the global financial moves and their implications.


More from Anil Panchal
Share:

Editor's Picks

AUD/USD flatlines near 0.6965 as less hawkish RBA counters USD weakness

AUD/USD holds steady above a two-week low, trading near 0.6965 in the Asian session on Wednesday as early midterm election results heighten political uncertainty and weigh heavily on the US Dollar. Moreover, reviving safe-haven demand triggers a fresh leg down in US bond yields, offsetting Fed hike bets and exerting additional pressure on the buck. However, a less hawkish RBA caps the Aussie.

USD/JPY declines below 158.00 as USD weakens on midterm election results

USD/JPY comes under heavy selling pressure on Wednesday, dropping below 158.00 during the Asian session as the US Dollar slumps to a one-month low amid heightened political uncertainty after early US midterm vote counts. Moreover, the prospect of gridlock in Washington drives safe-haven flows, triggering a fresh leg down in US bond yields and further weighing on the buck.

Gold ticks lower while early trend points to Democrats victory in House

Gold trades with caution at around $3,930 in the Asian trading session on Wednesday. The precious metal struggles to gain direction as investors shift their focus to United States Midterm elections where early trend shows that Democrats would have a clear majority in House of Representatives.

Ethereum: US-led selling keeps ETH below $2,309 realized price
Ethereum (ETH) faces pressure near $2,300 on Tuesday as it struggles to recover its realized price. The top altcoin fell below its realized price, or investors' average on-chain cost basis, at $2,309 following the $6.3 billion Binance hack last Thursday.
US Midterms: Can Wall Street rally despite AI debt and credit risks?
Political uncertainty may be coming to an end, but the real question for investors is whether the technology sector can sustain its enormous spending commitments. The US midterm elections are arriving at an interesting moment for financial markets.
The 2% inflation target came from a throwaway remark. It now moves trillions
The Federal Reserve's 2% inflation goal grew out of an off-the-cuff remark by a New Zealand politician in 1988. Bond investors still price long-term US debt as if 2% holds, so a change in how the Fed measures inflation would move markets.