|

USD/CHF Price Analysis: Slides below 200-HMA but 0.9045 appears a tough nut to crack for bears

  • USD/CHF takes offers to refresh intraday low, snaps two-day winning streak.
  • Bearish MACD signals, downside break of key moving average tease Swiss Franc pair bears.
  • Convergence of 50-HMA, immediate rising support line challenge sellers.

USD/CHF stands on slippery grounds as it drops to 0.9060 heading into Tuesday’s European session. In doing so, the Swiss Franc (CHF) pair prints the first daily loss in three while breaking the 200-Hour Moving Average (HMA) support.

Adding strength to the downside bias are the bearish MACD signals, as well as the RSI (14) reversal from the overbought territory. However, the RSI line’s current place is below the 50.0 level and suggests limited downside room for the USD/CHF pair.

With this, a convergence of the 50-HMA and an ascending trend line from the last Friday, around 0.9045 at the latest, gains the market’s attention as the key downside support.

Should the bears manage to break the stated strong support, a quick slump to the 0.9000 psychological magnet can’t be ruled out. However, the monthly low of 0.8985 and the previous monthly low of 0.8820 can challenge the USD/CHF pair sellers afterward.

Meanwhile, USD/CHF recovery needs to portray a successful trading beyond the 200-HMA level of 0.9065 at the latest.

Also acting as the short-term upside hurdle is the 61.8% Fibonacci retracement of the pair’s downturn from May 31 to June 09, near 0.9085.

Above all, the double top formation around 0.9110 appears crucial resistance for the USD/CHF bulls to cross to retake control.

USD/CHF: Hourly chart

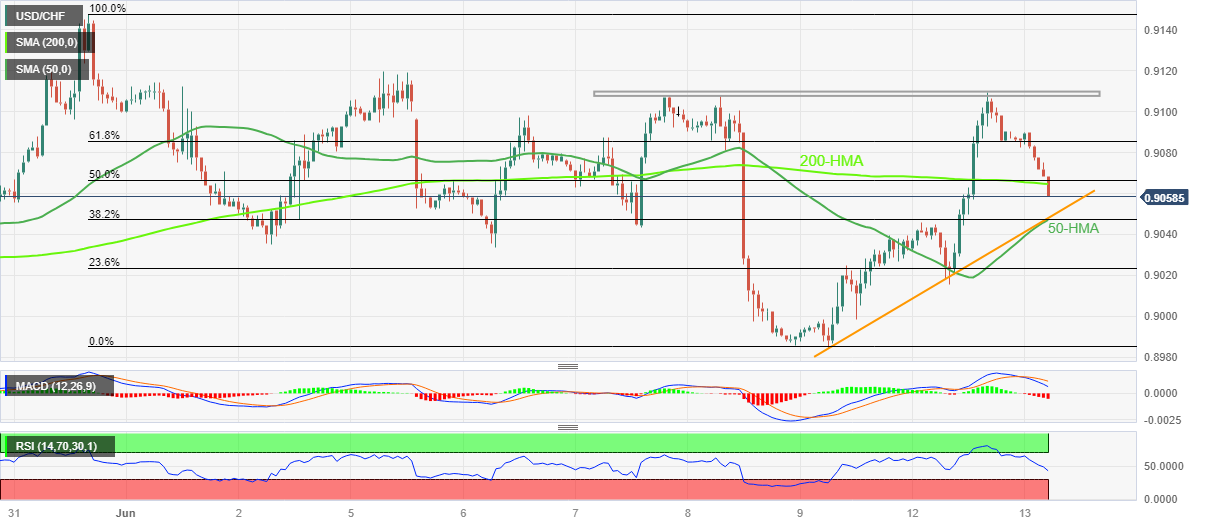
Trend: Limited downside expected

Additional important levels

Overview
Today last price0.9061
Today Daily Change-0.0029
Today Daily Change %-0.32%
Today daily open0.909
 
Trends
Daily SMA200.9043
Daily SMA500.8989
Daily SMA1000.9118
Daily SMA2000.9354
 
Levels
Previous Daily High0.9109
Previous Daily Low0.9016
Previous Weekly High0.912
Previous Weekly Low0.8984
Previous Monthly High0.9148
Previous Monthly Low0.882
Daily Fibonacci 38.2%0.9074
Daily Fibonacci 61.8%0.9051
Daily Pivot Point S10.9034
Daily Pivot Point S20.8978
Daily Pivot Point S30.8941
Daily Pivot Point R10.9128
Daily Pivot Point R20.9165
Daily Pivot Point R30.9221

Author

Anil Panchal

Anil Panchal

FXStreet

Anil Panchal has nearly 15 years of experience in tracking financial markets. With a keen interest in macroeconomics, Anil aptly tracks global news/updates and stays well-informed about the global financial moves and their implications.

More from Anil Panchal
Share:

Editor's Picks

EUR/USD seems fragile below 1.1700 as Middle East war boosts energy prices

The EUR/USD pair trades flat at around 1.1680 during the Asian trading session on Tuesday, but broadly seems vulnerable, being close to its five-week low. The major currency pair is under pressure as surging oil prices due to the United States-Israel war with Iran have increased the risks of higher inflation for the Old Continent.

GBP/USD hovers around 1.3400 with bearish pressure intact

GBP/USD edges higher after three days of losses, trading around 1.3400 during the Asian hours on Tuesday. The technical analysis of the daily chart indicates an ongoing bearish bias, as the pair trades within a descending channel pattern.

Gold sticks to gains above $5,350 amid sustained safe-haven demand; firmer USD caps gains

Gold sticks to its positive bias for the third straight day and trades above the $5,350 level heading into the European session on Tuesday. Concerns about a broader regional conflict in the Middle East continue to weigh on investors' sentiment and underpin demand for the traditional safe-haven bullion.

Stellar risks deeper losses as derivatives metrics turn negative

Stellar is trading red below $0.16 at the time of writing on Tuesday, after a slight recovery the previous day. Weakening derivatives data caps the recovery, while an unfavorable technical outlook projects a deeper correction for the XLM token in the upcoming days.

The market is not panicking it is repricing the probability distribution of Oil and time

At the end of the day, markets do not trade morality or geopolitics. They trade transmission channels. And the only channel that truly matters in this maelstrom runs through the price of energy and the time value of money.

Grass 20% bullish breakout defies broader market weakness

Grass (GRASS) is edging up above $0.30 at the time of writing on Monday. The token’s notable 20% intraday surge stands out amid heightened volatility in the broader crypto market.