USD/CHF Price Analysis: Retreats towards 0.9550 inside weekly rising wedge


  • USD/CHF takes offers to refresh intraday low, snaps six-day uptrend.
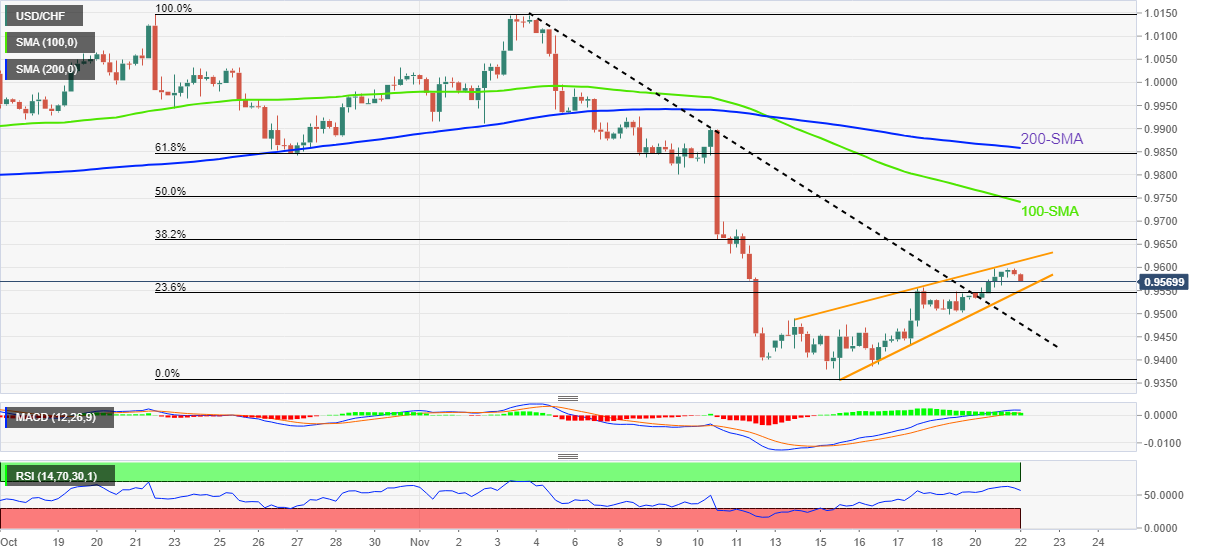
  • Rising wedge bearish chart pattern suggests 250-pips of downtrend on breaking 0.9550.
  • Fortnight-old previous resistance line adds to the downside filters.
  • Key SMAs challenge buyers before the double tops surrounding 1.0150.

USD/CHF renews intraday low near 0.9570 as bears sneak in after a six-day absence during early Tuesday.

With the Swiss Franc (CHF) pair’s latest retreat, the quote portrays a bearish chart pattern, namely a rising wedge, on the four-hour play and teases the sellers to aim for the 250-pip downtrend in case the quote drops below 0.9550 support.

However, the resistance-turned-support line from November 3, around 0.9475 by the press time, acts as an extra downside filter. Also likely to challenge the USD/CHF bears is the monthly low near 0.9355.

It’s worth noting that, the RSI retreat favors the pair’s latest pullback but the bullish MACD signals challenge the USDCHF bears.

Meanwhile, an upside clearance of the stated one-week-old rising wedge’s resistance line, near 0.9615 at the latest, defies the bearish formation and can propel the pair toward the 100-SMA hurdle of 0.9745.

Even so, the USD/CHF recovery remains elusive unless the quote stays below the 200-SMA level of 0.9860.

Even if the quote crosses the key SMA hurdle, the double tops around 1.0150 will be a crucial challenge for the USD/CHF bulls.

USD/CHF: Four-hour chart

Trend: Limited downside expected

Additional important levels

Overview
Today last price 0.957
Today Daily Change -0.0020
Today Daily Change % -0.21%
Today daily open 0.959
 
Trends
Daily SMA20 0.9771
Daily SMA50 0.9822
Daily SMA100 0.9736
Daily SMA200 0.9631
 
Levels
Previous Daily High 0.9598
Previous Daily Low 0.9533
Previous Weekly High 0.9558
Previous Weekly Low 0.9357
Previous Monthly High 1.0148
Previous Monthly Low 0.9781
Daily Fibonacci 38.2% 0.9573
Daily Fibonacci 61.8% 0.9558
Daily Pivot Point S1 0.9549
Daily Pivot Point S2 0.9508
Daily Pivot Point S3 0.9483
Daily Pivot Point R1 0.9614
Daily Pivot Point R2 0.9639
Daily Pivot Point R3 0.968


Share: Feed news

Information on these pages contains forward-looking statements that involve risks and uncertainties. Markets and instruments profiled on this page are for informational purposes only and should not in any way come across as a recommendation to buy or sell in these assets. You should do your own thorough research before making any investment decisions. FXStreet does not in any way guarantee that this information is free from mistakes, errors, or material misstatements. It also does not guarantee that this information is of a timely nature. Investing in Open Markets involves a great deal of risk, including the loss of all or a portion of your investment, as well as emotional distress. All risks, losses and costs associated with investing, including total loss of principal, are your responsibility. The views and opinions expressed in this article are those of the authors and do not necessarily reflect the official policy or position of FXStreet nor its advertisers. The author will not be held responsible for information that is found at the end of links posted on this page.

If not otherwise explicitly mentioned in the body of the article, at the time of writing, the author has no position in any stock mentioned in this article and no business relationship with any company mentioned. The author has not received compensation for writing this article, other than from FXStreet.

FXStreet and the author do not provide personalized recommendations. The author makes no representations as to the accuracy, completeness, or suitability of this information. FXStreet and the author will not be liable for any errors, omissions or any losses, injuries or damages arising from this information and its display or use. Errors and omissions excepted.

The author and FXStreet are not registered investment advisors and nothing in this article is intended to be investment advice.

Recommended content


Recommended content

Editors’ Picks

EUR/USD rises toward 1.0700 after Germany PMI data

EUR/USD rises toward 1.0700 after Germany PMI data

EUR/USD gains traction and rises toward 1.0700 in the early European session on Monday. HCOB Composite PMI in Germany improved to 50.5 in April from 47.7 in March, providing a boost to the Euro. Focus shifts Eurozone and US PMI readings.

EUR/USD News

GBP/USD eases below 1.2350, UK PMIs eyed

GBP/USD eases below 1.2350, UK PMIs eyed

GBP/USD is dropping below 1.2350 in the European session, as the US Dollar sees fresh buying interest on tepid risk sentiment. The further downside in the pair could remain capped, as traders await the UK PMI reports for fresh trading impetus. 

GBP/USD News

Gold price flirts with $2,300 amid receding safe-haven demand, reduced Fed rate cut bets

Gold price flirts with $2,300 amid receding safe-haven demand, reduced Fed rate cut bets

Gold price (XAU/USD) remains under heavy selling pressure for the second straight day on Tuesday and languishes near its lowest level in over two weeks, around the $2,300 mark heading into the European session.

Gold News

PENDLE price soars 10% after Arthur Hayes’ optimism on Pendle derivative exchange

PENDLE price soars 10% after Arthur Hayes’ optimism on Pendle derivative exchange

Pendle is among the top performers in the cryptocurrency market today, posting double-digit gains. Its peers in the altcoin space are not as forthcoming even as the market enjoys bullish sentiment inspired by Bitcoin price.

Read more

Focus on April PMIs today

Focus on April PMIs today

In the euro area, focus today will be on the euro area PMIs for April. The previous months' PMIs have shown a return of the two-speed economy with the service sector in expansionary territory and manufacturing sector stuck in contraction. 

Read more

Forex MAJORS

Cryptocurrencies

Signatures