|

USD/CHF Price Analysis: Immediate resistance line prods bulls around 0.8930 amid overbought RSI

  • USD/CHF bulls struggle to keep the reins at two-month high.
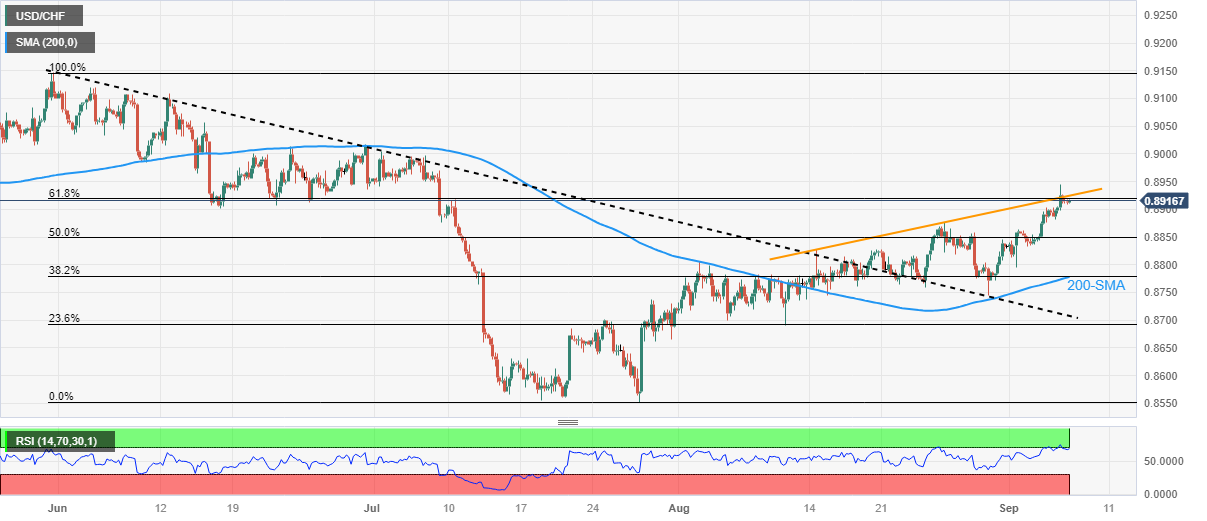
  • Overbought RSI (14) line joins three-week-old ascending trend line to challenge buyers.
  • Swiss Franc pair sellers need validation from 0.8780 support confluence, previous resistance line to retake control.

USD/CHF clings to mild gains around the highest levels in two months, lacks momentum near 0.8920 heading into Thursday’s European session during a three-day winning streak.

In doing so, the Swiss Franc (CHF) pair portrays the pair buyer’s struggle with a three-week-old rising resistance line amid the overbought RSI (14). However, a successful trading beyond the previous resistance line stretched from late May, as well as the 200-SMA keeps the bulls hopeful.

With this, the pair’s pullback towards the 0.8900 and then to the 50% Fibonacci retracement of May-July downside, near 0.8850 appears imminent.

A convergence of the 200-SMA and 38.2% Fibonacci ratio surrounding 0.8780 appears a tough nut to crack for the USD/CHF bears past 0.8850, a break of which will highlight the multi-day-old resistance-turned-support line of around 0.8720 as the last defense of the buyers.

On the flip side, a clear break of the aforementioned resistance line, close to 0.8930 needs validation from the recent peak surrounding 0.8945, as well as the Swiss Unemployment Rate for August, to convince the USD/CHF buyers.

Following that, a run-up towards the 0.9000 psychological magnet can’t be ruled out. Even so, the late June swing high of around 0.9020 may act as an extra filter toward the north.

USD/CHF: Four-hour chart

Trend: Pullback expected

Additional important levels

Overview
Today last price0.8917
Today Daily Change0.0005
Today Daily Change %0.06%
Today daily open0.8912
 
Trends
Daily SMA200.8816
Daily SMA500.8779
Daily SMA1000.8879
Daily SMA2000.9058
 
Levels
Previous Daily High0.8945
Previous Daily Low0.8881
Previous Weekly High0.8865
Previous Weekly Low0.8745
Previous Monthly High0.8876
Previous Monthly Low0.869
Daily Fibonacci 38.2%0.8921
Daily Fibonacci 61.8%0.8906
Daily Pivot Point S10.888
Daily Pivot Point S20.8849
Daily Pivot Point S30.8817
Daily Pivot Point R10.8944
Daily Pivot Point R20.8976
Daily Pivot Point R30.9007

Author

Anil Panchal

Anil Panchal

FXStreet

Anil Panchal has nearly 15 years of experience in tracking financial markets. With a keen interest in macroeconomics, Anil aptly tracks global news/updates and stays well-informed about the global financial moves and their implications.

More from Anil Panchal
Share:

Markets move fast. We move first.

Orange Juice Newsletter brings you expert driven insights - not headlines. Every day on your inbox.

By subscribing you agree to our Terms and conditions.

Editor's Picks

EUR/USD flatlines below 1.1800 amid trading lull, awaits Fed Minutes

EUR/USD trades around a flatline below 1.1800 in European trading on Tuesday. The pair lacks any trading impetus as the US Dollar moves little amid market caution ahead of the Fed's December Meeting Minutes release, which could offer insights into the Federal Reserve’s 2026 outlook.

GBP/USD retakes 1.3500 despite the year-end grind

GBP/USD finds fresh demand and retakes 1.3500 on Tuesday as markets grind through the last trading week of the year. Despite the latest uptick, the pair is unlikely to see further progress due to the year-end holiday volumes.

Gold holds the bounce on Fed rate cut bets, safe-haven flows

Gold holds the rebound near $4,350 in the European trading hours on Tuesday. The precious metal recovers some lost ground after falling 4.5% in the previous session, which was Gold's largest single-day loss since October. Increased margin requirements on gold and silver futures by the Chicago Mercantile Exchange Group, one of the world’s largest trading floors for commodities, prompted widespread profit-taking and portfolio rebalancing.

Tron steadies as Justin Sun invests $18 million in Tron Inc.

Tron (TRX) trades above $0.2800 at press time on Monday, hovering below the 50-day Exponential Moving Average (EMA) at $0.2859.

Economic outlook 2026-2027 in advanced countries: Solidity test

After a year marked by global economic resilience and ending on a note of optimism, 2026 looks promising and could be a year of solid economic performance. In our baseline scenario, we expect most of the supportive factors at work in 2025 to continue to play a role in 2026.

Crypto market outlook for 2026

Year 2025 was volatile, as crypto often is.  Among positive catalysts were favourable regulatory changes in the U.S., rise of Digital Asset Treasuries (DAT), adoption of AI and tokenization of Real-World-Assets (RWA).

USD/CHF Price Analysis: Immediate resistance line prods bulls around 0.8930 amid overbought RSI