• USD/CHF buyers reclaim 0.9600 and lift the major to a daily high of 0.9651.
  • Broad US dollar strength amidst an augmented risk appetite, tailwind for the USD/CHF.
  • A trendline break in the hourly chart exacerbates the USD/CHF rally above 0.9600.

The USD/CHF rallies above the 100-day EMA and extended its gains to two straight days, up by more than a half percent, on risk-on impulse,  as US bond yields rise, underpinned by Fed’s hawkish commentary. The greenback is also trading positive, as depicted by the US Dollar Index, climbing 0.18%, sitting at 106.546. At the time of writing, the USD/CHF is trading at 0.9625.

USD/CHF Price Analysis: Technical outlook

In yesterday’s article, I mentioned that “the USD/CHF edged higher, forming a bullish-engulfing chart pattern, a reversal pattern indicating buyers outweigh sellers, keeping risks skewed to the upside.” On Wednesday, the USD/CHF advanced sharply, cracking the 100-day EMA at 0.9626, as the major extended its gains towards the daily high at 0.9651. Although the USD/CHF is retracing, the major remains neutral-to-bullish biased. That said, USD/CHF traders should be aware of a move towards the confluence of the 50 and 20-day EMAs around 0.9674-77.

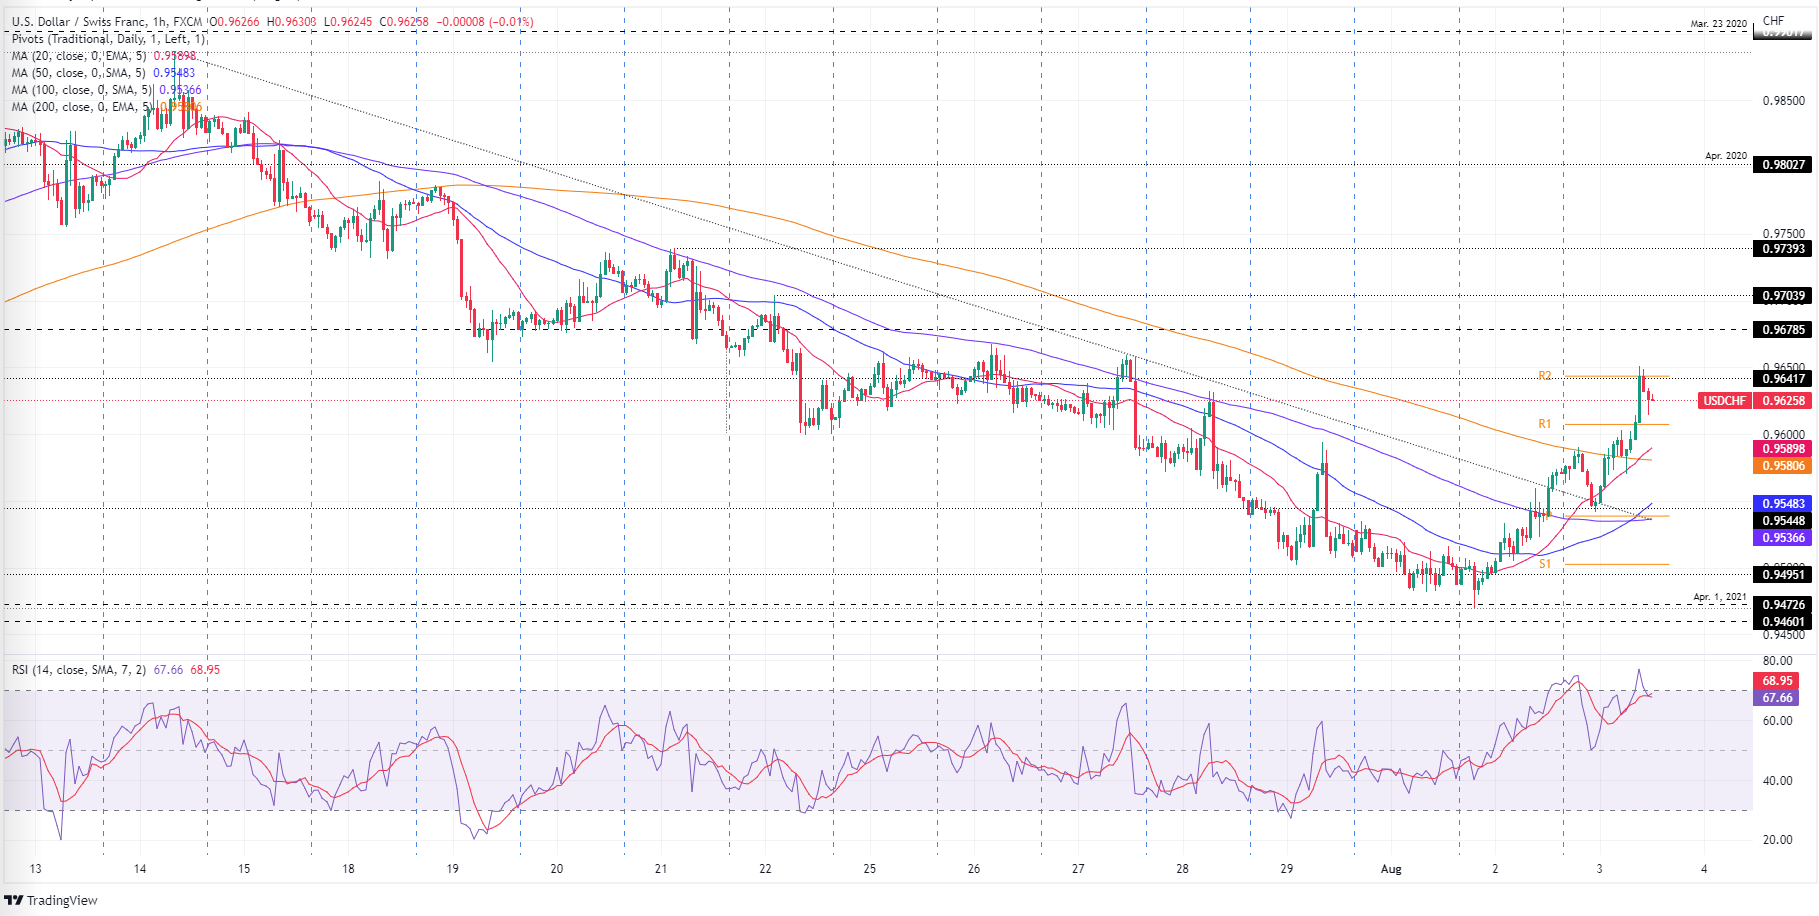
USD/CHF 1-hour chart

The USD/CHF is upward biased once the major broke solid resistance at a fifteen-day-old downslope trendline around 0.9559, putting a lid on Tuesday’s rally towards 0.9600. Additionally, the major reclaimed the 200-hour EMA at 0.9580, which exacerbated a jump above the 0.9600 area. That said, the USD/CHF first resistance would be the R2 daily pivot at 0.9644, shy of Wednesday’s daily high at 0.9651. Once cleared, the USD/CHF’s following resistance levels will be the July 22 daily high at 0.9704 and July 21 high at 0.9739.

USD/CHF Key Technical Levels

USD/CHF

Overview
Today last price 0.9625
Today Daily Change 0.0051
Today Daily Change % 0.53
Today daily open 0.9576
 
Trends
Daily SMA20 0.9686
Daily SMA50 0.968
Daily SMA100 0.9618
Daily SMA200 0.9417
 
Levels
Previous Daily High 0.9576
Previous Daily Low 0.9471
Previous Weekly High 0.9668
Previous Weekly Low 0.9502
Previous Monthly High 0.9886
Previous Monthly Low 0.9502
Daily Fibonacci 38.2% 0.9536
Daily Fibonacci 61.8% 0.9511
Daily Pivot Point S1 0.9506
Daily Pivot Point S2 0.9435
Daily Pivot Point S3 0.94
Daily Pivot Point R1 0.9612
Daily Pivot Point R2 0.9647
Daily Pivot Point R3 0.9717


Share: Feed news

Information on these pages contains forward-looking statements that involve risks and uncertainties. Markets and instruments profiled on this page are for informational purposes only and should not in any way come across as a recommendation to buy or sell in these assets. You should do your own thorough research before making any investment decisions. FXStreet does not in any way guarantee that this information is free from mistakes, errors, or material misstatements. It also does not guarantee that this information is of a timely nature. Investing in Open Markets involves a great deal of risk, including the loss of all or a portion of your investment, as well as emotional distress. All risks, losses and costs associated with investing, including total loss of principal, are your responsibility. The views and opinions expressed in this article are those of the authors and do not necessarily reflect the official policy or position of FXStreet nor its advertisers. The author will not be held responsible for information that is found at the end of links posted on this page.

If not otherwise explicitly mentioned in the body of the article, at the time of writing, the author has no position in any stock mentioned in this article and no business relationship with any company mentioned. The author has not received compensation for writing this article, other than from FXStreet.

FXStreet and the author do not provide personalized recommendations. The author makes no representations as to the accuracy, completeness, or suitability of this information. FXStreet and the author will not be liable for any errors, omissions or any losses, injuries or damages arising from this information and its display or use. Errors and omissions excepted.

The author and FXStreet are not registered investment advisors and nothing in this article is intended to be investment advice.

Recommended content


Recommended content

Editors’ Picks

EUR/USD clings to daily gains above 1.0650

EUR/USD clings to daily gains above 1.0650

EUR/USD gained traction and turned positive on the day above 1.0650. The improvement seen in risk mood following the earlier flight to safety weighs on the US Dollar ahead of the weekend and helps the pair push higher.

EUR/USD News

GBP/USD recovers toward 1.2450 after UK Retail Sales data

GBP/USD recovers toward 1.2450 after UK Retail Sales data

GBP/USD reversed its direction and advanced to the 1.2450 area after touching a fresh multi-month low below 1.2400 in the Asian session. The positive shift seen in risk mood on easing fears over a deepening Iran-Israel conflict supports the pair.

GBP/USD News

Gold holds steady at around $2,380 following earlier spike

Gold holds steady at around $2,380 following earlier spike

Gold stabilized near $2,380 after spiking above $2,400 with the immediate reaction to reports of Israel striking Iran. Meanwhile, the pullback seen in the US Treasury bond yields helps XAU/USD hold its ground.

Gold News

Bitcoin Weekly Forecast: BTC post-halving rally could be partially priced in Premium

Bitcoin Weekly Forecast: BTC post-halving rally could be partially priced in

Bitcoin price shows no signs of directional bias while it holds above  $60,000. The fourth BTC halving is partially priced in, according to Deutsche Bank’s research. 

Read more

Week ahead – US GDP and BoJ decision on top of next week’s agenda

Week ahead – US GDP and BoJ decision on top of next week’s agenda

US GDP, core PCE and PMIs the next tests for the Dollar. Investors await BoJ for guidance about next rate hike. EU and UK PMIs, as well as Australian CPIs also on tap.

Read more

Forex MAJORS

Cryptocurrencies

Signatures