USD/CHF Price Analysis: Bears take a breather on the way to 0.9085


  • USD/CHF remains on the back foot despite latest inaction.
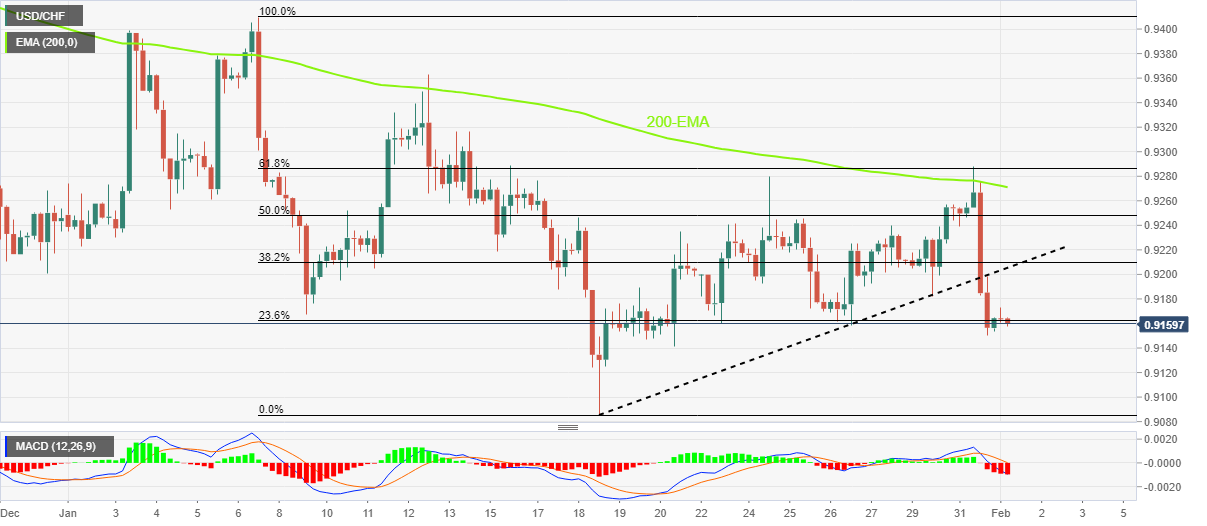
  • Sustained break of fortnight-old ascending trend line, U-turn from 200-EMA favor sellers.
  • Buyers need successful trading below 61.8% Fibonacci retracement to retake control.

USD/CHF holds lower ground near 0.9160 during early Wednesday, following a clear downside break of the previous key support line.

The Swiss currency (CHF) pair’s latest inaction could be linked to the market’s cautious mood ahead of the Federal Open Market Committee (FOMC) monetary policy meeting.

However, the bearish MACD signals and a U-turn from the 200-bar Exponential Moving Average (EMA) seem to join the trend line break to keep sellers hopeful.

That said, multiple lows marked during January 18-20, close to 0.9150-45, seem to restrict the immediate downside of the USD/CHF pair.

Following that, a previous monthly low, as well as the yearly bottom, near 0.9085 will be in focus.

It should be noted that the 0.9100 threshold could act as an additional downside filter for the pair traders to watch during the weakness past 0.9145 while the August 2021 low near 0.9018 may challenge the USD/CHF bears past 0.9085.

Meanwhile, recovery moves need to cross the previous support line from January 18, close to 0.9205 by the press time, to recall the pair buyers.

Even so, the 200-EMA and the 61.8% Fibonacci retracement level of the pair’s January moves, respectively near 0.9270 and 0.9285, could probe the USD/CHF upside.

USD/CHF: Four-hour chart

Trend: Further downside expected

Additional important levels

Overview
Today last price 0.9159
Today Daily Change 0.0005
Today Daily Change % 0.05%
Today daily open 0.9154
 
Trends
Daily SMA20 0.9235
Daily SMA50 0.9304
Daily SMA100 0.9562
Daily SMA200 0.9628
 
Levels
Previous Daily High 0.9288
Previous Daily Low 0.915
Previous Weekly High 0.928
Previous Weekly Low 0.9158
Previous Monthly High 0.941
Previous Monthly Low 0.9085
Daily Fibonacci 38.2% 0.9203
Daily Fibonacci 61.8% 0.9236
Daily Pivot Point S1 0.9107
Daily Pivot Point S2 0.906
Daily Pivot Point S3 0.8969
Daily Pivot Point R1 0.9245
Daily Pivot Point R2 0.9336
Daily Pivot Point R3 0.9383


Share: Feed news

Information on these pages contains forward-looking statements that involve risks and uncertainties. Markets and instruments profiled on this page are for informational purposes only and should not in any way come across as a recommendation to buy or sell in these assets. You should do your own thorough research before making any investment decisions. FXStreet does not in any way guarantee that this information is free from mistakes, errors, or material misstatements. It also does not guarantee that this information is of a timely nature. Investing in Open Markets involves a great deal of risk, including the loss of all or a portion of your investment, as well as emotional distress. All risks, losses and costs associated with investing, including total loss of principal, are your responsibility. The views and opinions expressed in this article are those of the authors and do not necessarily reflect the official policy or position of FXStreet nor its advertisers. The author will not be held responsible for information that is found at the end of links posted on this page.

If not otherwise explicitly mentioned in the body of the article, at the time of writing, the author has no position in any stock mentioned in this article and no business relationship with any company mentioned. The author has not received compensation for writing this article, other than from FXStreet.

FXStreet and the author do not provide personalized recommendations. The author makes no representations as to the accuracy, completeness, or suitability of this information. FXStreet and the author will not be liable for any errors, omissions or any losses, injuries or damages arising from this information and its display or use. Errors and omissions excepted.

The author and FXStreet are not registered investment advisors and nothing in this article is intended to be investment advice.

Recommended content


Recommended content

Editors’ Picks

How will US Dollar react to Q1 GDP data? – LIVE

How will US Dollar react to Q1 GDP data? – LIVE

The US' GDP is forecast to grow at an annual rate of 2.5% in the first quarter of the year. The US Dollar struggles to find demand as investors stay on the sidelines, while waiting to assess the impact of the US economic performance on the Fed rate outlook. 

FOLLOW US LIVE

EUR/USD holds gains above 1.0700, as key US data loom

EUR/USD holds gains above 1.0700, as key US data loom

EUR/USD holds gains above 1.0700 in the European session on Thursday. Renewed US Dollar weakness offsets the risk-off market environment, supporting the pair ahead of the key US GDP and PCE inflation data. 

EUR/USD News

GBP/USD extends recovery above 1.2500, awaits US GDP data

GBP/USD extends recovery above 1.2500, awaits US GDP data

GBP/USD is catching a fresh bid wave, rising above 1.2500 in European trading on Thursday. The US Dollar resumes its corrective downside, as traders resort to repositioning ahead of the high-impact US advance GDP data for the first quarter. 

GBP/USD News

Gold price edges higher amid weaker USD and softer risk tone, focus remains on US GDP

Gold price edges higher amid weaker USD and softer risk tone, focus remains on US GDP

Gold price (XAU/USD) attracts some dip-buying in the vicinity of the $2,300 mark on Thursday and for now, seems to have snapped a three-day losing streak, though the upside potential seems limited. 

Gold News

XRP extends its decline, crypto experts comment on Ripple stablecoin and benefits for XRP Ledger

XRP extends its decline, crypto experts comment on Ripple stablecoin and benefits for XRP Ledger

Ripple extends decline to $0.52 on Thursday, wipes out weekly gains. Crypto expert asks Ripple CTO how the stablecoin will benefit the XRP Ledger and native token XRP. 

Read more

Forex MAJORS

Cryptocurrencies

Signatures