|

USD/CHF Price Analysis: Bears seek acceptance above 0.9600

  • USD/CHF retreats from monthly top as buyers struggle after six-day uptrend.
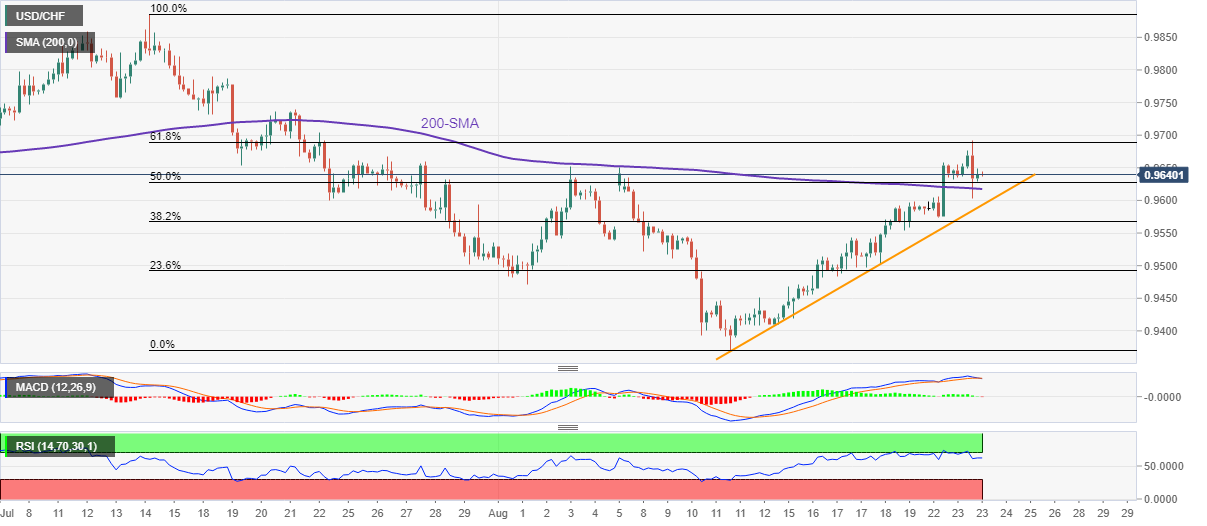
  • 61.8% Fibonacci retracement triggered pullback amid overbought RSI, looming bear cross on MACD.
  • 200-SMA, two-week-old ascending trend line restricts immediate downside.

USD/CHF keeps the previous day’s pullback from a one-month high as sellers flirt with the 50% Fibonacci retracement of the July-August downside during Wednesday’s Asian session. That said, the Swiss currency (CHF) pair remains pressured at around 0.9640 by the press time.

In doing so, the quote portrays a reversal from the 61.8% Fibonacci retracement, known as the golden ratio, amid the RSI retreat from the overbought territory and an impending bear cross of the MACD.

It’s worth noting, however, that the 200-SMA and an upward sloping support line from August 11, respectively around 0.9615 and 0.9590, challenge the USD/CHF bears.

Should the pair decline below 0.9590, the odds of witnessing a slump towards the 23.6% Fibonacci retracement level surrounding 0.9490 appear brighter. Following that, the monthly low of 0.9370 will be in focus.

Meanwhile, recovery moves remain elusive unless crossing the golden ratio, around 0.9690.

Even so, the July 13 swing low near 0.9750 precedes the previous monthly high surrounding 0.9885 could lure the USD/CHF bulls.

USD/CHF: Four-hour chart

Trend: Further downside expected

Additional important levels

Overview
Today last price0.9638
Today Daily Change-0.0003
Today Daily Change %-0.03%
Today daily open0.9641
 
Trends
Daily SMA200.9539
Daily SMA500.9635
Daily SMA1000.965
Daily SMA2000.9443
 
Levels
Previous Daily High0.9659
Previous Daily Low0.9574
Previous Weekly High0.9598
Previous Weekly Low0.9409
Previous Monthly High0.9886
Previous Monthly Low0.9502
Daily Fibonacci 38.2%0.9626
Daily Fibonacci 61.8%0.9606
Daily Pivot Point S10.959
Daily Pivot Point S20.954
Daily Pivot Point S30.9506
Daily Pivot Point R10.9676
Daily Pivot Point R20.971
Daily Pivot Point R30.9761

Author

Anil Panchal

Anil Panchal

FXStreet

Anil Panchal has nearly 15 years of experience in tracking financial markets. With a keen interest in macroeconomics, Anil aptly tracks global news/updates and stays well-informed about the global financial moves and their implications.

More from Anil Panchal
Share:

Editor's Picks

EUR/USD holds above 1.1750 after mixed EU PMI data

EUR/USD manages to hold above 1.1750 but struggles to gather recovery momentum on Friday, following the mixed February PMI figures from Germany and the Eurozone. In the second half of the day, Q4 GDP, December inflation and February PMI data from the US will be watched closely by market participants.

GBP/USD recovers further toward 1.3500 after UK PMI data

GBP/USD is recovering ground further toward 1.3500 in European trading on Friday, helped by a modest uptick in the Pound Sterling after stronger-than-expected UK January Retail Sales and February PMI data. However, the pair's further upside could be limited amid persistent US Dollar strength as the focus turns to key US data. 

Gold sticks to positive bias above $5,000 ahead of US data

Gold gains some positive traction for the third consecutive day on Friday. holding above $5,000. Traders now look forward to the key US macro releases – the Advance Q4 GDP report and the Personal Consumption Expenditures (PCE) Price Index – for fresh trading impetus. 

US GDP growth expected to slow down significantly in Q4 after stellar Q3 

The United States Bureau of Economic Analysis will publish the first preliminary estimate of the fourth-quarter Gross Domestic Product at 13:30 GMT. Analysts forecast the US economy to have expanded at a 3% annualized rate, slowing down from the 4.4% growth posted in the previous quarter.

Iran tensions and AI fears at the forefront ahead of key US data

Thursday’s scorecard shows major US Stock benchmarks closed modestly in the red amid mounting US-Iran tensions and AI disruption worries. The S&P 500 shed 19 points (0.3%) to 6,861, the Nasdaq 100 lost 101 points (0.4%) to 24,797, and the Dow Jones Industrial Average dropped 267 points (0.5%) to 49,395.

Official Trump price approaches breakout with mixed signals from traders

Official Trump (TRUMP) is trading at $3.50 at the time of writing, approaching its upper consolidation range. A breakout from this range could open the door for an upside move. On-chain data shows market indecision, with balanced flows between bulls and bears, signaling a lack of clear directional bias.