|

USD/CHF Price Analysis: Bearish continuation pattern, rectangle spotted on hourly charts

  • A strong pickup in the USD demand assisted USD/CHF to regain traction on Monday.
  • The risk-off mood underpinned the safe-haven CHF and capped gains for the major.
  • The formation of a rectangle on hourly charts supports prospects for further losses.

The USD/CHF pair retreated around 15-20 pips from the daily tops and was last seen trading with modest intraday gains, around mid-0.9100s.

Worries about the spread of the highly contagious Delta variant of the coronavirus weighed on investors' sentiment. This was evident from the prevalent risk-off mood, which underpinned the safe-haven Swiss franc and capped the upside for the USD/CHF pair.

That said, expectations that the Fed could be moving closer to tighten its monetary policy sooner than anticipated acted as a tailwind for the US dollar. This, in turn, continued lending some support to the USD/CHF pair and helped limit any meaningful slide.

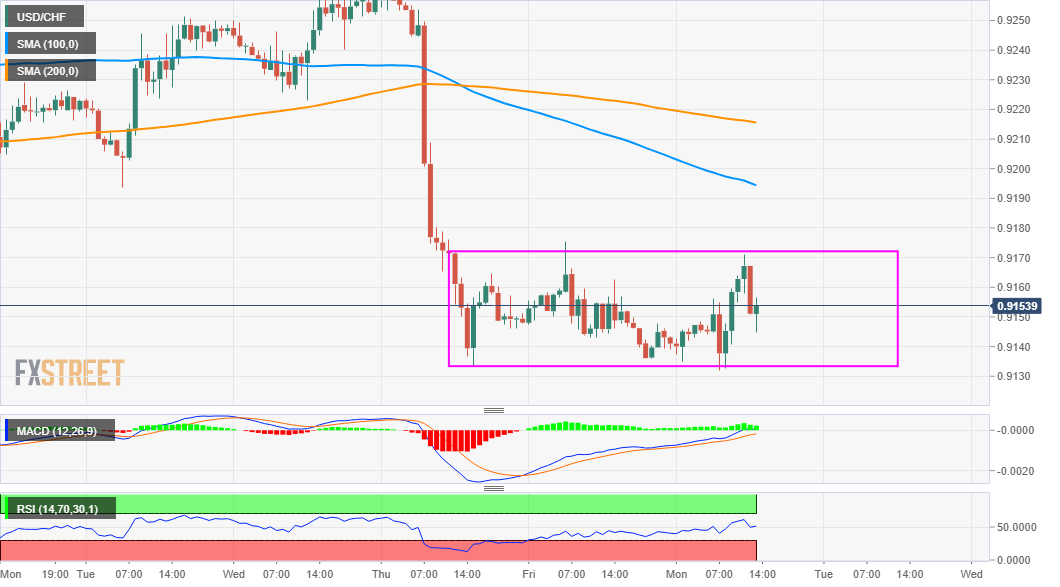
From a technical perspective, the intraday movement remained confined in Friday's broader trading range, forming a rectangle on hourly charts. Given the recent sharp pullback, the rectangle might be categorized as a bearish continuation pattern.

Meanwhile, technical indicators on the daily chart have been losing positive traction and add credence to the negative setup. However, RSI on the 4-hour chart remains close to the oversold territory and warrants some caution for aggressive bearish traders.

Hence, it will be prudent to wait for some strong follow-through selling below the 0.9130 region, or the daily swing lows, before positioning for any further depreciating move. The USD/CHF pair might then accelerate the slide towards the 0.9100 mark.

Any subsequent decline is likely to find decent support near the very important 200-day SMA, currently around the 0.9070 region. Failure to defend the mentioned support levels will be seen as a fresh trigger for bearish traders and prompt fresh technical selling.

On the flip side, the 0.9170-75 region might continue to act as immediate strong resistance. This is followed by the 0.9200 round-figure mark, which if cleared should allow the USD/CHF pair to retest three-month tops, around the 0.9270-75 region touched earlier this month.

USD/CHF 1-hour chart

fxsoriginal

Technical levels to watch

USD/CHF

Overview
Today last price0.9151
Today Daily Change0.0011
Today Daily Change %0.12
Today daily open0.914
 
Trends
Daily SMA200.9174
Daily SMA500.9076
Daily SMA1000.9157
Daily SMA2000.9071
 
Levels
Previous Daily High0.9175
Previous Daily Low0.9136
Previous Weekly High0.9268
Previous Weekly Low0.9133
Previous Monthly High0.9262
Previous Monthly Low0.8926
Daily Fibonacci 38.2%0.9151
Daily Fibonacci 61.8%0.916
Daily Pivot Point S10.9125
Daily Pivot Point S20.9111
Daily Pivot Point S30.9086
Daily Pivot Point R10.9165
Daily Pivot Point R20.919
Daily Pivot Point R30.9204

Author

Haresh Menghani

Haresh Menghani is a detail-oriented professional with 10+ years of extensive experience in analysing the global financial markets.

More from Haresh Menghani
Share:

Markets move fast. We move first.

Orange Juice Newsletter brings you expert driven insights - not headlines. Every day on your inbox.

By subscribing you agree to our Terms and conditions.

Editor's Picks

EUR/USD trims losses and returns to the 1.1750 area

The US Dollar resumed its decline in the American afternoon, helping EUR/USD trim early losses. The pair trades around 1.1750 as market participants gear up for the European Central Bank monetary policy decision and the United States Consumer Price Index.

GBP/USD flirts with 1.3400 after nearing 1.3300

The GBP/USD changed course after dipping with UK inflation data, and trades near the 1.3400 mark, as investors expect the Bank of England to deliver a 25 basis points interest rate cut after the two-day meeting on Thursday.

Gold maintains its positive momentum, trades around $4,330

The XAU/USD pair gained on a deteriorated market mood, trading near its weekly highs near $4,340. The bright metal advances with caution as market players await first-tier events in Europe and hte United States.

Bitcoin risks deeper correction as ETF outflows mount, derivative traders stay on the sidelines

Bitcoin (BTC) remains under pressure, trading below $87,000 on Wednesday, nearing a key support level. A decisive daily close below this zone could open the door to a deeper correction.

Monetary policy: Three central banks, three decisions, the same caution

While the Fed eased its monetary policy on 10 December for the third consecutive FOMC meeting, without making any guarantees about future action, the BoE, the ECB and the BoJ are holding their respective meetings this week. 

Crypto Today: Bitcoin, Ethereum, XRP slide further as risk-off sentiment deepens

Bitcoin faces extended pressure as institutional investors reduce their risk exposure. Ethereum’s upside capped at $3,000, weighed down by ETF outflows and bearish signals. XRP slides toward November’s support at $1.82 despite mild ETF inflows.