USD/CHF looking for a second consecutive day of gains, clawing towards 0.8800
- The USD/CHF is grinding higher to eke out a second daily high, but momentum remains thin.
- The US Dollar remains steeply sold-off against the Swiss Franc.
- Economic calendar data leans heavily into the US side this week, culminating in another NFP print.

The USD/CHF is continuing to climb for a second trading day, with the US Dollar (USD) getting propped up by broad-market risk-off flows rather than any specific weakness in the Swiss Franc (CHF), which is up over 3% against the USD since early November.
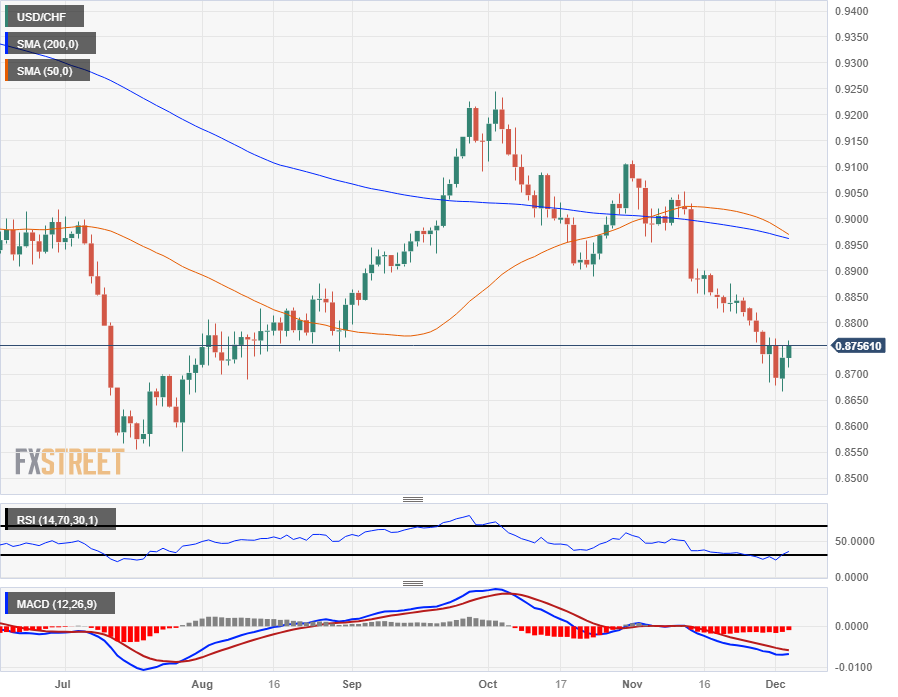
The USD/CHF has seen one-sided trading, closing flat or in the red for fifteen straight trading days before hitting a near-term bottom of 0.8666. With Tuesday seeing meager gains for the US Dollar, the USD/CHF is set to close with back-to-back meaningful gains since October.
US JOLTS Job Openings in October missed market forecasts, dipping to a two-and-a-half-year low of 8.733 million job postings, slipping past the forecast 9.3 million, and declining even further away from September's print of 9.35 million (revised down slightly from 9.553 million).
The US labor market remains tight, which makes it harder for the Federal Reserve (Fed) to accelerate the pace towards a rate cut cycle, and investors are ogling market data in the hopes of finding the cracks in the dataset that will signal Fed rate cuts sooner rather than later.
As it stands, markets are anticipating rate cuts from the Fed in the first half of next year, though still-high economic indicators make it hard for the Fed to execute on market hopes. On the downside, investors are walking a knife-edge when it comes to data expectations: if US economic data goes too red, too quick, a full-blown recession will be terrible for markets.
USD/CHF Technical Outlook
The USD/CHF remains steeply in the red in the medium-term despite intraday gains this week, and the US Dollar is down against the Swiss Franc looking out across 2023.
The USD/CHF saw an accelerated decline after dropping through in 0.8900 handle in November, and the pair has continued to swirl the drain ever since, shedding another 200 pips to hit chart territory near the 0.8700 handle.
The 200-day Simple Moving Average (SMA) has steadily declined through the 0.9000 major handle as long-term momentum leans into the Dollar-bearish side. The 50-day SMA is set for a bearish crossover of the 200-day SMA after the shorter moving average failed to see a bullish market shift materialize after a short-lived bullish crossover in November.
USD/CHF Daily Chart
USD/CHF Technical Levels
Author

Joshua Gibson
FXStreet
Joshua joins the FXStreet team as an Economics and Finance double major from Vancouver Island University with twelve years' experience as an independent trader focusing on technical analysis.