USD/CAD technical analysis: Struggles near 23.6% Fibo, 1.3224/32 becomes key resistance
- USD/CAD lacks momentum around 23.6% Fibonacci retracement.
- 38.2% Fibonacci retracement, 100/200-day EMA restrict immediate upside.
- Multiple stops before 1.3000 limit pair’s short-term declines.

Following its U-turn from 1.3200, USD/CAD clings to 23.6% Fibonacci retracement of May-July downside while taking rounds to 1.3140 during early Monday
The lack of momentum could also be witnessed by nearly a flat curve of the 14-day Relative Strength Index (RSI).
While a downside break below July-end low of 1.3105 could reignite possibilities of pair’s another south-run towards 1.3000 mark, with 1.3042 and 1.3015 being intermediate halts, buyers need to clear 1.3224/32 area comprising 38.2% Fibonacci retracement and 100/200-day Exponential Moving Average (EMA) to extend recovery.
Should prices rally beyond 1.3232 on a daily closing basis, 50% and 61.8% Fibonacci retracement levels of 1.3290 and 1.3355 could be on bull’s watch-list.
On the contrary, the pair’s decline below 1.3000 could target mid-October 2018 low around 1.2915.
USD/CAD daily chart
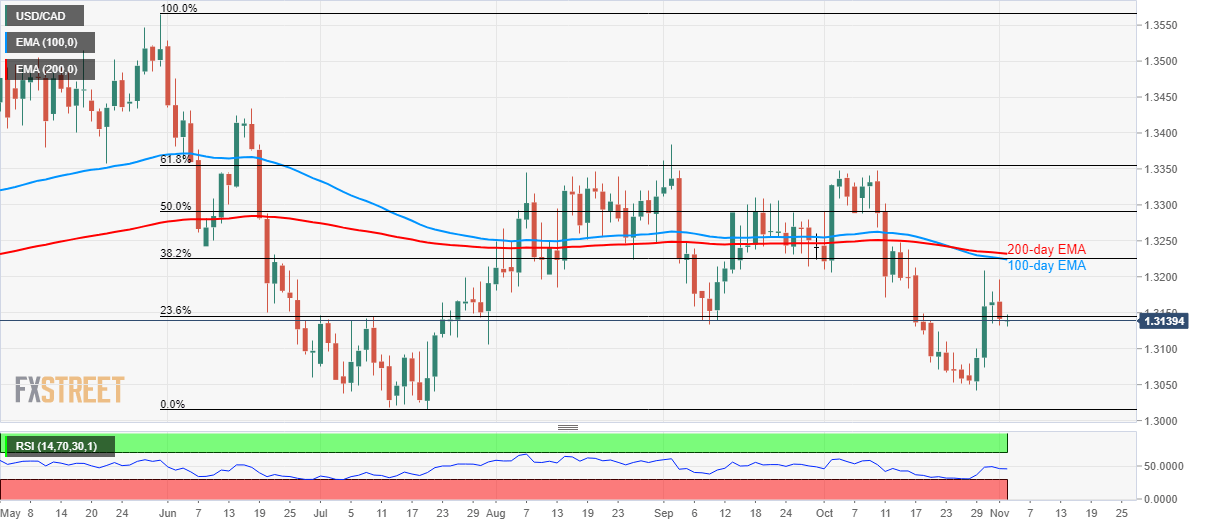
Trend: sideways
Author

Anil Panchal
FXStreet
Anil Panchal has nearly 15 years of experience in tracking financial markets. With a keen interest in macroeconomics, Anil aptly tracks global news/updates and stays well-informed about the global financial moves and their implications.


