USD/CAD Technical Analysis: How high can the Greenback fly against the Loonie?

USD/CAD daily chart
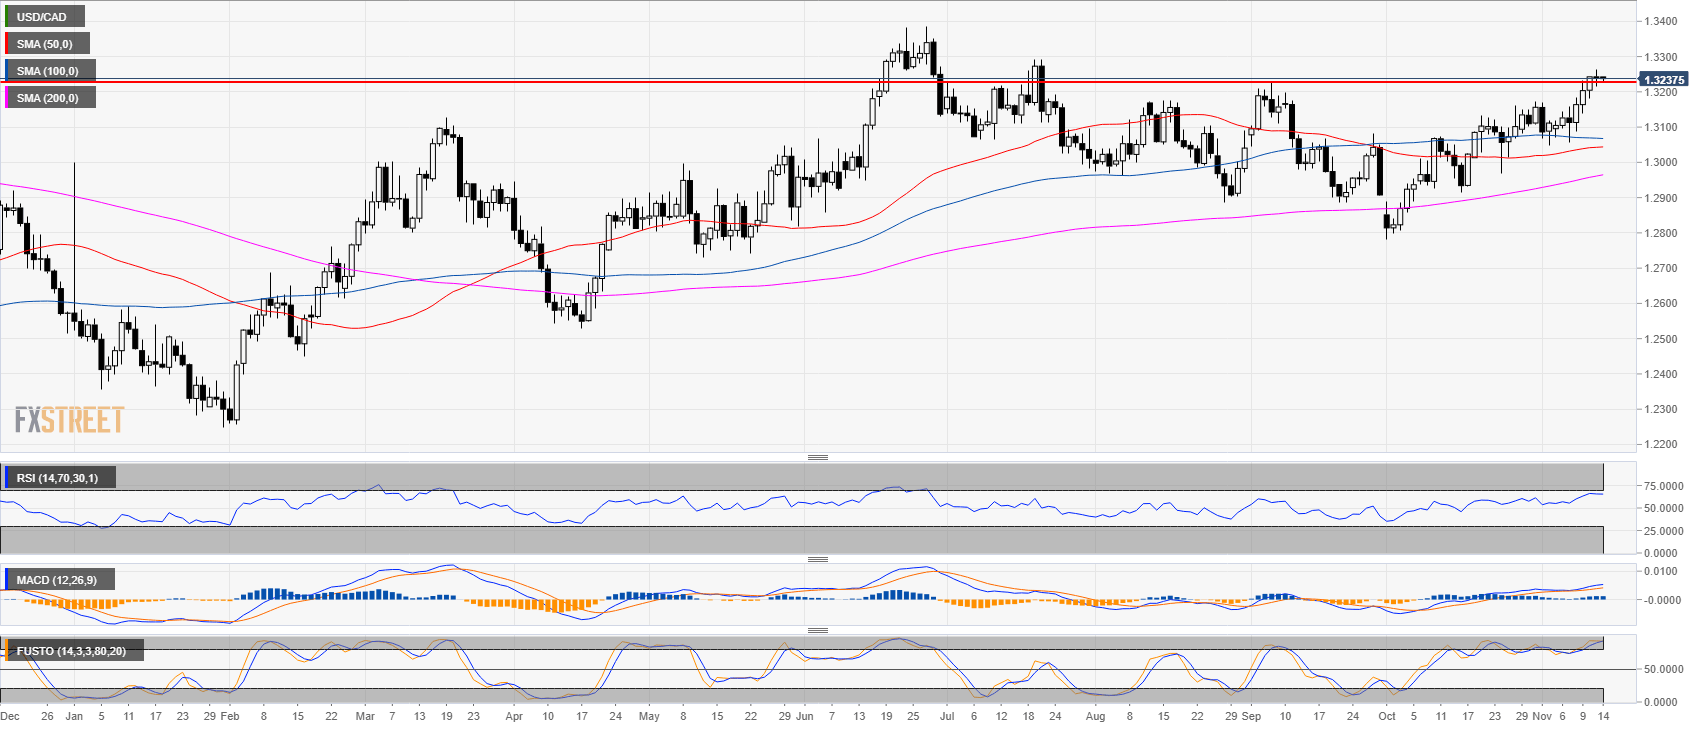
- USD/CAD is ending Tuesday virtually unchanged below 1.3250 brick wall.
- USD/CAD is attempting to break meaningfully above the September high.
USD/CAD 4-hour chart
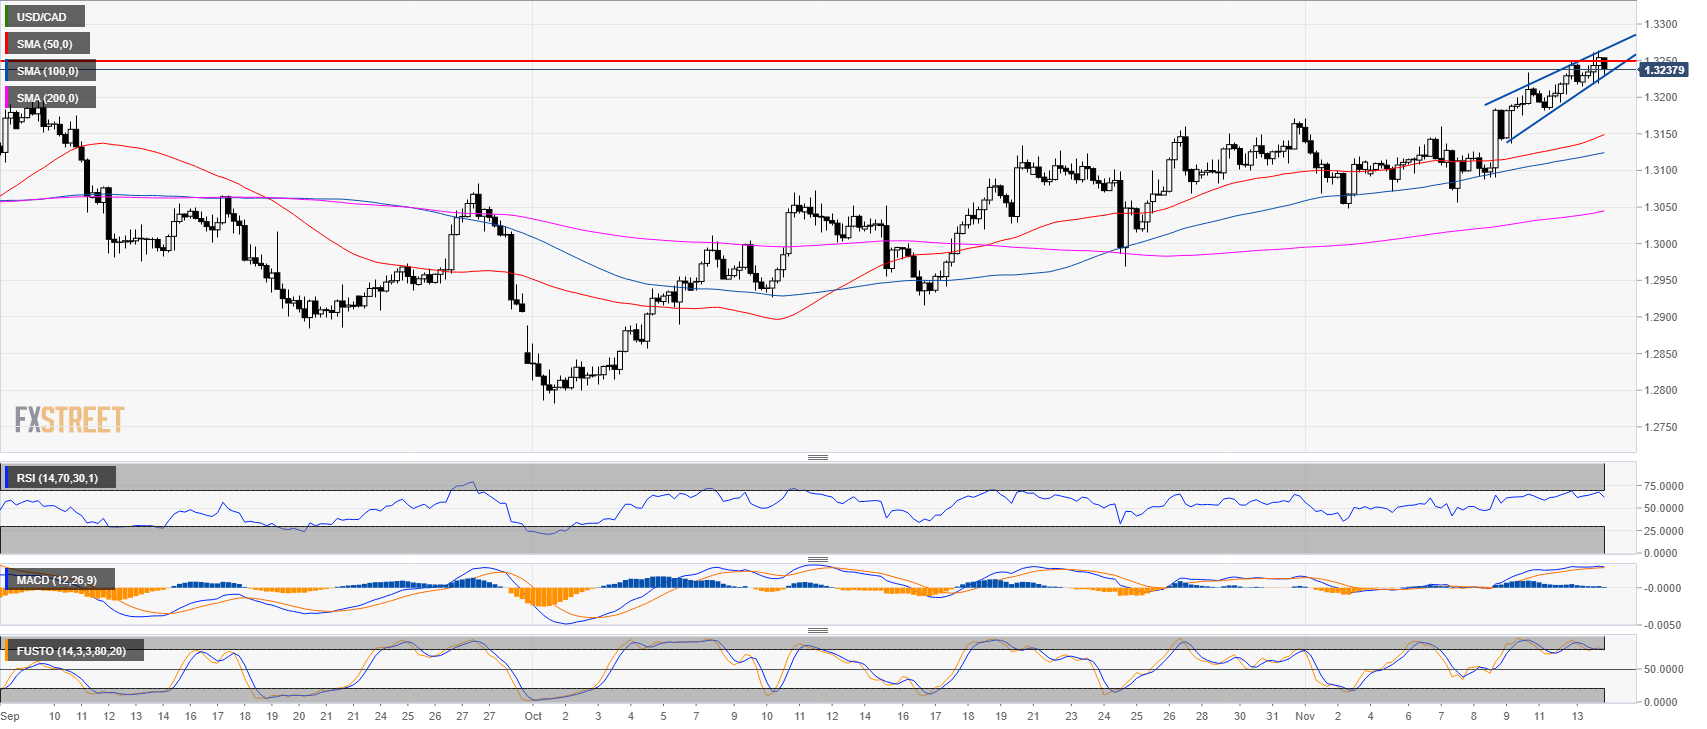
- USD/CAD is evolving in a small rising wedge just below 1.3250 in what appears to be a crowded trade to the upside.
- The Stochastic indicator is decelerating.
USD/CAD 30-minute chart
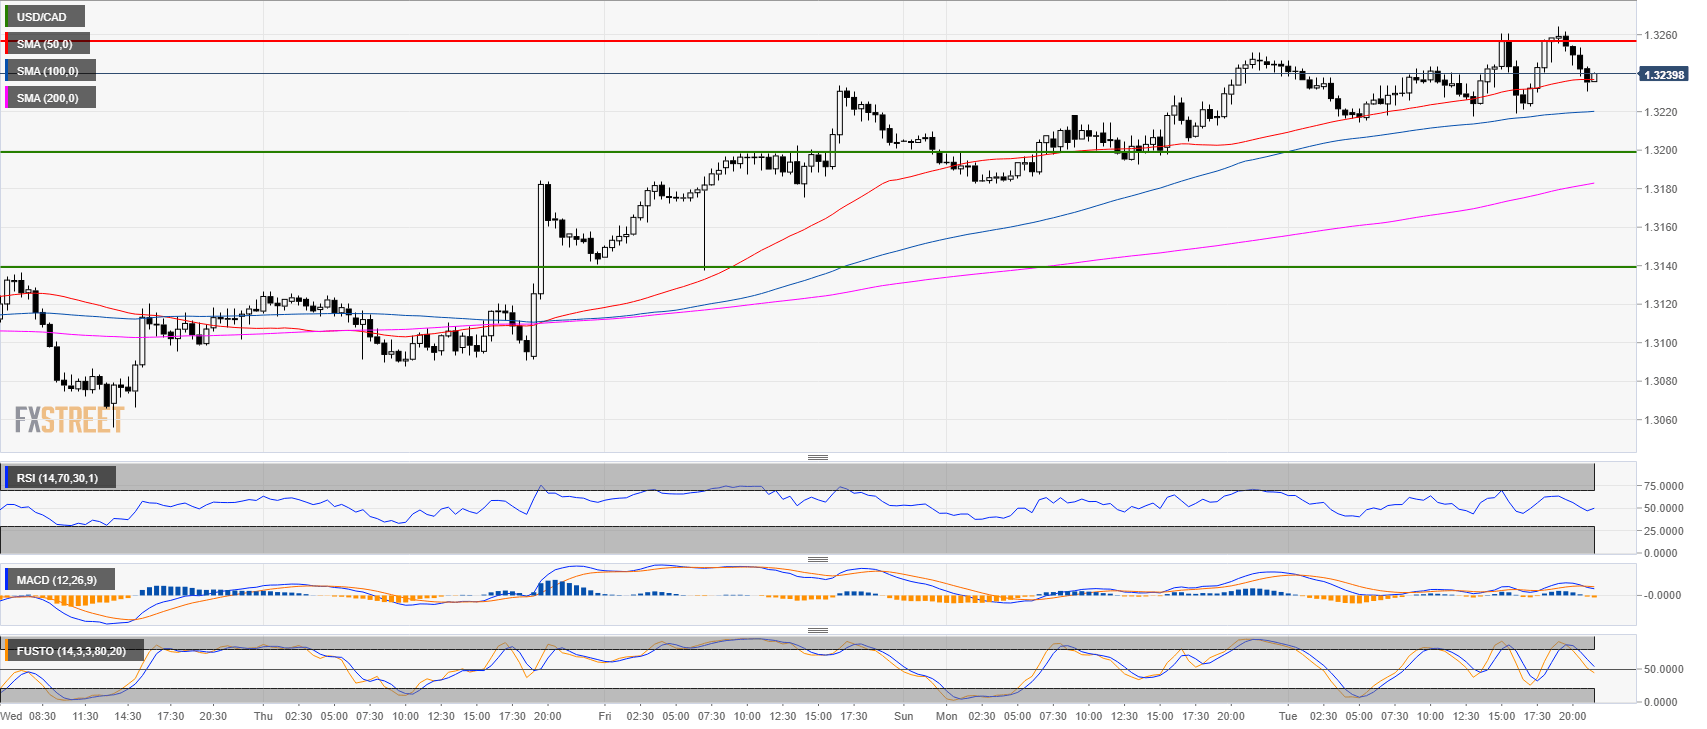
- Bulls objective is to break above 1.3250. It is most likely that any attempts above the level would soon fail.
- Bears will try to reach 1.3200 and 1.3140 to the downside.
Additional key levels at a glance:
USD/CAD
Overview:
Last Price: 1.3238
Daily change: -5.0 pips
Daily change: -0.0378%
Daily Open: 1.3243
Trends:
Daily SMA20: 1.3106
Daily SMA50: 1.3041
Daily SMA100: 1.3071
Daily SMA200: 1.2951
Levels:
Daily High: 1.3245
Daily Low: 1.3182
Weekly High: 1.3233
Weekly Low: 1.3056
Monthly High: 1.3172
Monthly Low: 1.2783
Daily Fibonacci 38.2%: 1.3221
Daily Fibonacci 61.8%: 1.3206
Daily Pivot Point S1: 1.3202
Daily Pivot Point S2: 1.3161
Daily Pivot Point S3: 1.314
Daily Pivot Point R1: 1.3264
Daily Pivot Point R2: 1.3285
Daily Pivot Point R3: 1.3326
Author

Flavio Tosti
Independent Analyst


