|
USD/CAD Technical Analysis: Break of 1.3200-1.3195 support-area signals further downside

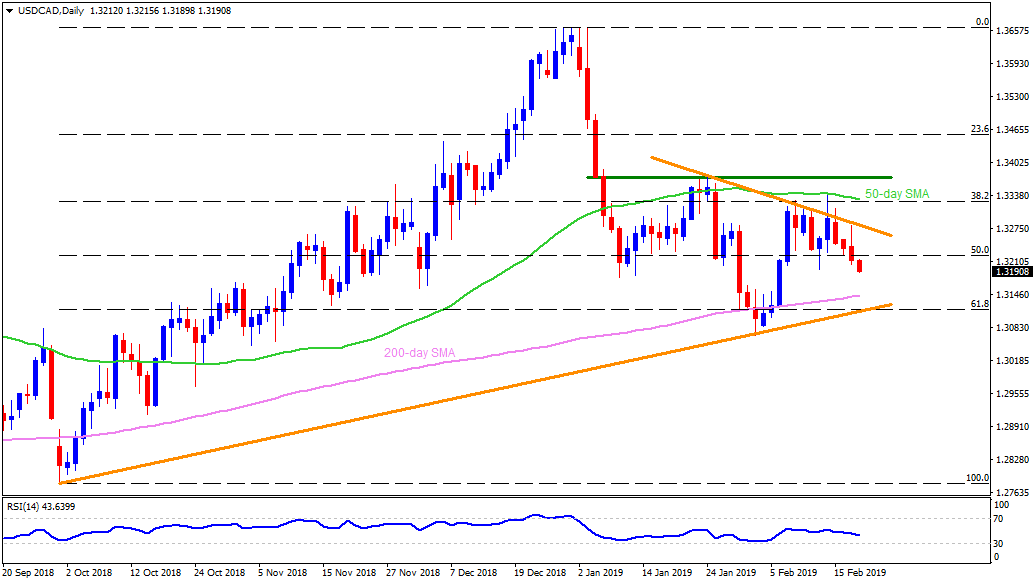
USD/CAD daily chart
- The USD/CAD dropped below 1.3195 during the early Asian trading on Wednesday.
- The pair’s trading under February 13 low of 1.3195 signal extension to recent decline towards 1.3155 and a 200-day simple moving average of 1.3140.
- However, an upward sloping support-line stretched since October 2018 and 61.8% Fibonacci retracement of October January upside can confine the pair’s additional south-run at 1.3110.
- On the upside, 1.3285 and 50-day SMA level of 1.3335 could please the buyers ahead of challenging them with 1.3375.
- In case prices rally beyond 1.3375, 1.3440 and 1.3500 might flash on bulls’ radar to target.
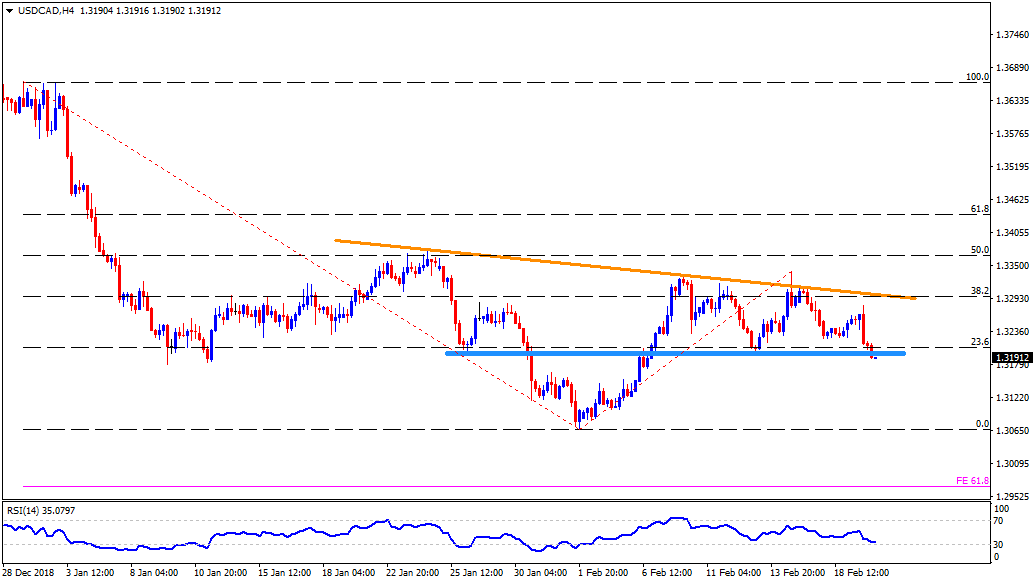
USD/CAD 4-Hour chart
- The four-hour chart aptly portrays 1.3200-1.3195 support-zone, now resistance, and 1.3155 rest-point while emphasizing 1.3065 and 61.8% Fibonacci expansion of January to mid-February moves, at 1.2965 afterward.
- Meanwhile, 1.3265 and 1.3300 appear as adjacent resistances to follow.
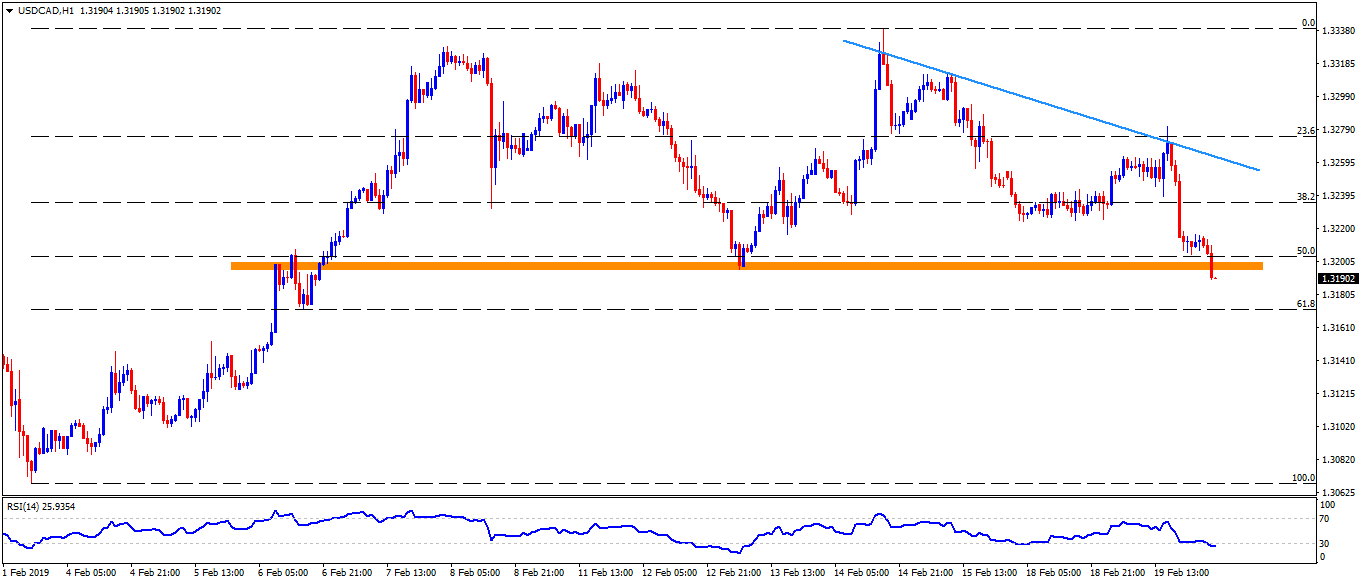
USD/CAD hourly chart
- On hourly chart, the pair needs to validate its past-1.3195 dip by clearing 1.3150 support in order to entertain sellers with 1.3100 and 1.3065.
- Alternatively, 1.3225 and 1.3250 can limit the pair’s close moves before 1.3265 and 1.3310 take charge.
Author

Anil Panchal
FXStreet
Anil Panchal has nearly 15 years of experience in tracking financial markets. With a keen interest in macroeconomics, Anil aptly tracks global news/updates and stays well-informed about the global financial moves and their implications.
More from Anil Panchal


