USD/CAD Price Forecast: Aims to stabilize above 1.3700 as Trump imposes 35% tariffs on Canada
- USD/CAD moves higher after US President Trump sends letter to Canada, dictating 35% tariff rate.
- Trump also considers raising tariff blanket rate from 10% to “15% or 20%”.
- Investors await the Canadian labor market data for June.

The USD/CAD pair gives back some of its initial gains during the European trading session on Friday. Still, the Loonie pair trades firmly near the key level of 1.3700. The pair strengthens as the Canadian Dollar (CAD) underperforms across the board, following the imposition of 35% United States (US) tariffs on Canada, separate from sectoral levies.
Canadian Dollar PRICE Today
The table below shows the percentage change of Canadian Dollar (CAD) against listed major currencies today. Canadian Dollar was the weakest against the Australian Dollar.
| USD | EUR | GBP | JPY | CAD | AUD | NZD | CHF | |
|---|---|---|---|---|---|---|---|---|
| USD | 0.05% | 0.20% | 0.37% | 0.24% | -0.10% | 0.15% | -0.03% | |
| EUR | -0.05% | 0.14% | 0.31% | 0.18% | -0.08% | 0.10% | -0.09% | |
| GBP | -0.20% | -0.14% | 0.20% | 0.03% | -0.20% | -0.00% | -0.25% | |
| JPY | -0.37% | -0.31% | -0.20% | -0.11% | -0.47% | -0.24% | -0.42% | |
| CAD | -0.24% | -0.18% | -0.03% | 0.11% | -0.29% | -0.10% | -0.28% | |
| AUD | 0.10% | 0.08% | 0.20% | 0.47% | 0.29% | 0.31% | -0.00% | |
| NZD | -0.15% | -0.10% | 0.00% | 0.24% | 0.10% | -0.31% | -0.23% | |
| CHF | 0.03% | 0.09% | 0.25% | 0.42% | 0.28% | 0.00% | 0.23% |
The heat map shows percentage changes of major currencies against each other. The base currency is picked from the left column, while the quote currency is picked from the top row. For example, if you pick the Canadian Dollar from the left column and move along the horizontal line to the US Dollar, the percentage change displayed in the box will represent CAD (base)/USD (quote).
On Thursday, US President Trump sent letter to Canada, specifying tariff rates, which will become effective from August 1. The letter also stated that higher tariff rate includes Fentanyl levy, which Trump imposed on Canada after returning to the White House for pouring drugs into the US economy.
However, President Trump has assured that he would consider adjustments in tariff rates if the nation cooperates on restricting the drug flow.
Additionally, US President Trump has also threatened to increase blanket levy from 10% to “15% or 20%” and is prepared to send letter, dictating tariff rates, to the European Union (EU) sooner.
Meanwhile, the US Dollar (USD) trades firmly after fresh tariff threats from Donald Trump, sending the US Dollar Index (DXY), higher to near 97.90.
In Friday’s session, investors will focus on the Canadian labor market data for June, which will be published at 12:30 GMT.
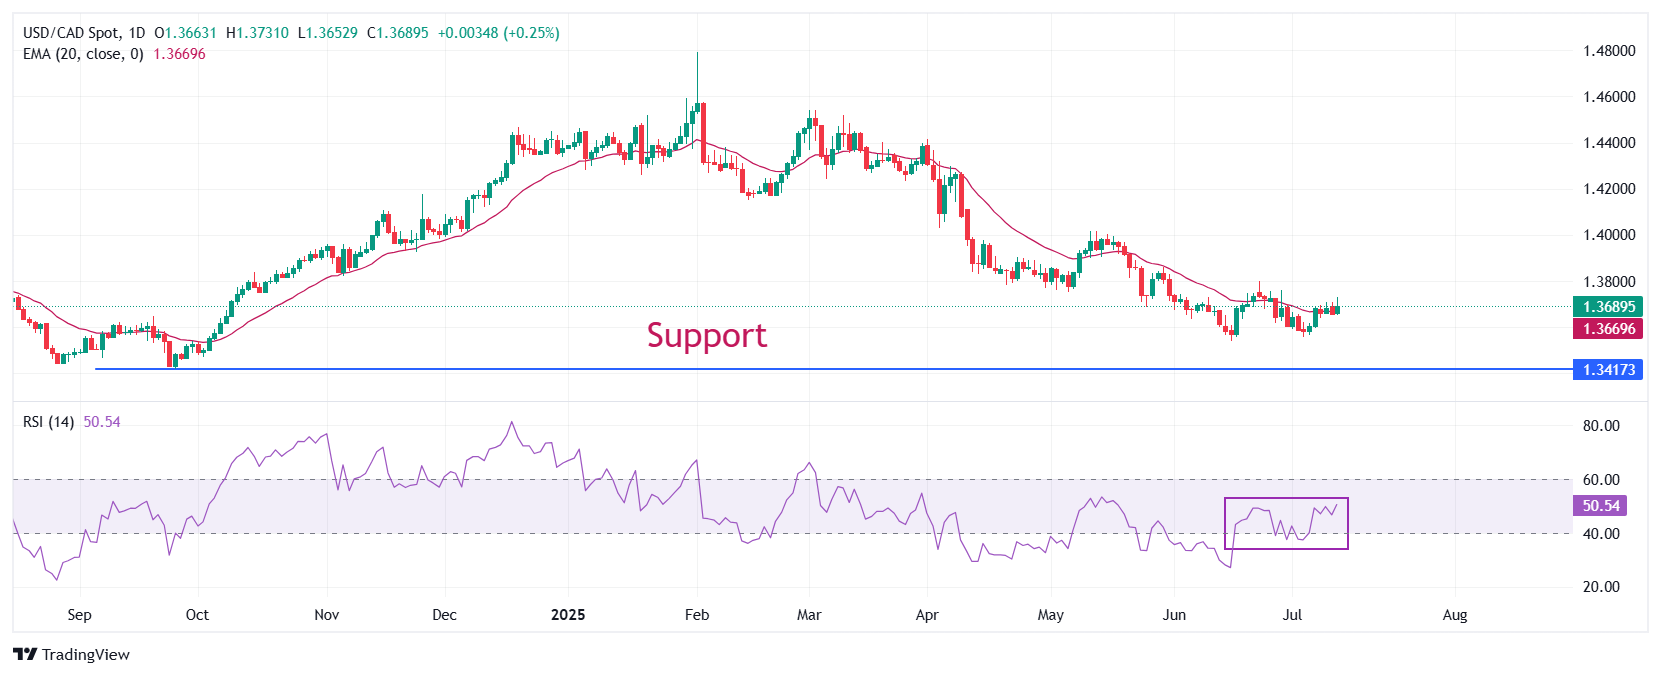
USD/CAD strives to break the three-day range between 1.3638 and 1.3710 on the upside. The pair continues to wobble around the 20-day Exponential Moving Average (EMA), which trades close to 1.3670.
The 14-day Relative Strength Index (RSI) hovers around 50.00, indicating that the pair lack momentum on either side.
Going forward, an upside move by the pair above the May 29 high of 1.3820 would open the door towards the May 21 high of 1.3920, followed by the May 15 high of 1.4000.
On the contrary, the asset could slide towards the psychological level of 1.3500 and the September 25 low of 1.3420 if it breaks below the June 16 low of 1.3540.
USD/CAD daily chart
Canadian Dollar FAQs
The key factors driving the Canadian Dollar (CAD) are the level of interest rates set by the Bank of Canada (BoC), the price of Oil, Canada’s largest export, the health of its economy, inflation and the Trade Balance, which is the difference between the value of Canada’s exports versus its imports. Other factors include market sentiment – whether investors are taking on more risky assets (risk-on) or seeking safe-havens (risk-off) – with risk-on being CAD-positive. As its largest trading partner, the health of the US economy is also a key factor influencing the Canadian Dollar.
The Bank of Canada (BoC) has a significant influence on the Canadian Dollar by setting the level of interest rates that banks can lend to one another. This influences the level of interest rates for everyone. The main goal of the BoC is to maintain inflation at 1-3% by adjusting interest rates up or down. Relatively higher interest rates tend to be positive for the CAD. The Bank of Canada can also use quantitative easing and tightening to influence credit conditions, with the former CAD-negative and the latter CAD-positive.
The price of Oil is a key factor impacting the value of the Canadian Dollar. Petroleum is Canada’s biggest export, so Oil price tends to have an immediate impact on the CAD value. Generally, if Oil price rises CAD also goes up, as aggregate demand for the currency increases. The opposite is the case if the price of Oil falls. Higher Oil prices also tend to result in a greater likelihood of a positive Trade Balance, which is also supportive of the CAD.
While inflation had always traditionally been thought of as a negative factor for a currency since it lowers the value of money, the opposite has actually been the case in modern times with the relaxation of cross-border capital controls. Higher inflation tends to lead central banks to put up interest rates which attracts more capital inflows from global investors seeking a lucrative place to keep their money. This increases demand for the local currency, which in Canada’s case is the Canadian Dollar.
Macroeconomic data releases gauge the health of the economy and can have an impact on the Canadian Dollar. Indicators such as GDP, Manufacturing and Services PMIs, employment, and consumer sentiment surveys can all influence the direction of the CAD. A strong economy is good for the Canadian Dollar. Not only does it attract more foreign investment but it may encourage the Bank of Canada to put up interest rates, leading to a stronger currency. If economic data is weak, however, the CAD is likely to fall.
Author

Sagar Dua
FXStreet
Sagar Dua is associated with the financial markets from his college days. Along with pursuing post-graduation in Commerce in 2014, he started his markets training with chart analysis.


