|

USD/CAD Price Analysis: Positive beyond 200-day SMA, 50% Fibonacci

  • USD/CAD pierces an eight-week-old falling resistance line.
  • 61.8% Fibonacci retracement adds to the upside barriers.
  • 100-day SMA could lure sellers during the pullback.

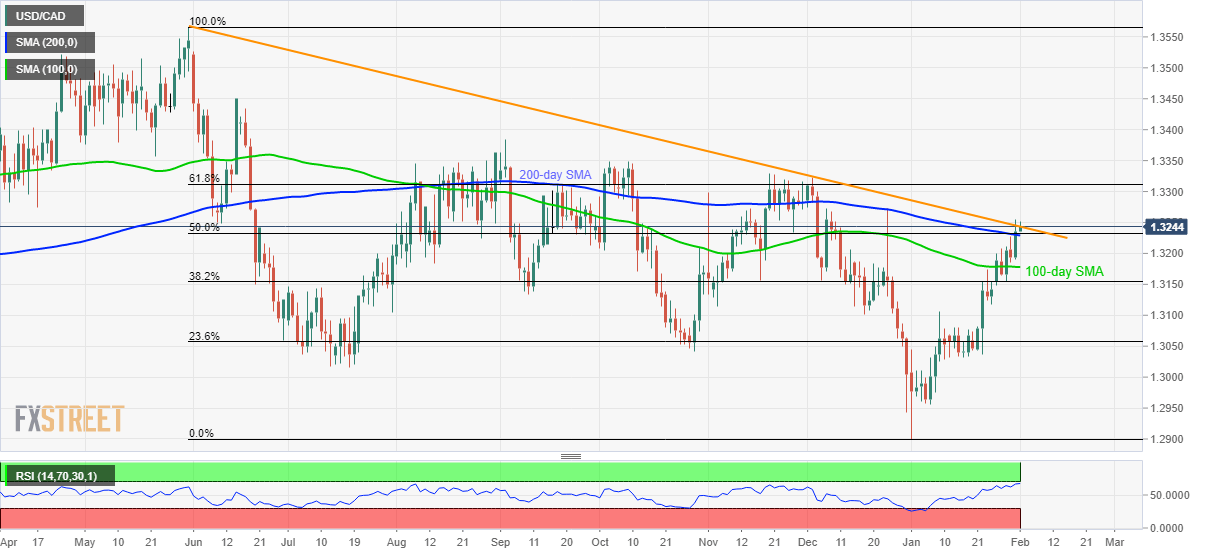
USD/CAD trades modestly positive around 1.3245 ahead of the European session on Monday. In doing so, the quote seesaws near the strongest in 2020 while also challenges a downward sloping trend line since May 31, 2019. However, RSI conditions are nearly overbought.

As a result, the bulls will wait for entry on the daily closing beyond the 1.3245 resistance line. With that, 61.8% Fibonacci retracement of the pair’s declines from May 2019 to January 2020, at 1.3315, will be on the buyer’s radar.

In a case, the USD/CAD prices fail to close beyond 1.3245 on a daily closing basis, sellers will not cheer the performance as 200-day SMA and 50% Fibonacci retracement, near 1.3230, challenges the bears.

On the break of 1.3230, a 100-day SMA level of 1.3178 and 38.2% Fibonacci retracement near 1.3150 could please the sellers.

USD/CAD daily chart

Trend: Bullish

Additional important levels

Overview
Today last price1.3243
Today Daily Change7 pips
Today Daily Change %0.05%
Today daily open1.3236
 
Trends
Daily SMA201.3097
Daily SMA501.314
Daily SMA1001.3178
Daily SMA2001.3228
 
Levels
Previous Daily High1.3255
Previous Daily Low1.319
Previous Weekly High1.3255
Previous Weekly Low1.3148
Previous Monthly High1.3255
Previous Monthly Low1.29
Daily Fibonacci 38.2%1.323
Daily Fibonacci 61.8%1.3215
Daily Pivot Point S11.3199
Daily Pivot Point S21.3162
Daily Pivot Point S31.3134
Daily Pivot Point R11.3264
Daily Pivot Point R21.3292
Daily Pivot Point R31.3329

Author

Anil Panchal

Anil Panchal

FXStreet

Anil Panchal has nearly 15 years of experience in tracking financial markets. With a keen interest in macroeconomics, Anil aptly tracks global news/updates and stays well-informed about the global financial moves and their implications.

More from Anil Panchal
Share:

Editor's Picks

EUR/USD flat lines near 1.1800 as traders brace for US PPI release

The EUR/USD pair trades on a flat note near 1.1800 during the early Asian session on Friday. The pair steadies as softer Eurozone inflation offsets US tariff uncertainties. Traders await the preliminary reading of the Consumer Price Index from Germany on Friday for more clues about the pace of future policy easing. On the US front, the Producer Price Index report will be released. 

GBP/USD threatens the 200-day SMA near 1.3440

GBP/USD rapidly leaves behind Wednesday’s strong advance, coming under heavy pressure and retesting the 1.3440 zone, where the critical 200-day SMA is located. Cable’s deep pullback follows the strong gains in the Greenback, while investors continue to pencil in a potential BoE rate cut in March.

Gold awaits acceptance above $5,200 and US PPI data

Gold consolidates previous rebound near $5,200 amid risk-off markets, awaiting US PPI release. The US Dollar eyes a flattish weekly close as dovish Fed outlook and tariff woes outweigh geopolitical risks. Gold yearns for acceptance above $5,200 to resume the uptrend, with a bullish RSI in play.

Top Crypto Gainers: Stable and Decred rally, Pippin approaches record highs

Altcoins, such as Stable, Decred, and Pippin, are extending gains so far this week, defying the risk-averse conditions in the broader cryptocurrency market. Stable and Pippin are near record high levels, while Decred extends its breakout rally above $30.

Changing the game: International implications of recent tariff developments

The Supreme Court ruling on International Emergency Economic Powers Act (IEEPA) tariffs provides limited relief for the rest of the world, with weighted average tariff rates modestly lower.

Bitcoin steadies as traders eye US–Iran talks

Bitcoin (BTC) price is stabilizing around $68,000 at the time of writing on Thursday after a 6.2% relief rally the previous day amid a broader downward trend.