|

USD/CAD Price Analysis: Finds support near 1.3500 as Oil price edge down

  • USD/CAD finds cushion near 1.3500 as Oil prices drop on tighter supply concerns.
  • The US Dollar moves higher while risk-sensitive currencies edge down amid uncertainty ahead of US data.
  • The Loonie is expected to blow out of the ascending Triangle formation.

The USD/CAD pair discovers a temporary support near the psychological support of 1.3500 in the European session on Monday. The Loonie asset finds cushion as the Oil prices edge down after a three-day rally.

The appeal for the Oil prices remains buoyant on tighter supply concerns. OPEC pledges to extend production cuts by the June end. Also, Ukraine’s drone attacks on some Russian refineries have deepened supply concerns. It is worth noting that Canada is the leading exporter of oil to the United States and higher Oil prices strengthen the Canadian Dollar.

Meanwhile, the US Dollar rises slightly to 104.58 amid caution ahead of the United States Nonfarm Payrolls (NFP) and related labor market data this week. The market is experiencing asset-specific action as risk-perceived currencies are down while US equity futures have posted significant gains.

In today’s session, investors will focus on the United States ISM Manufacturing PMI data for March, which will be published at 14:00 GMT. The factory data is estimated to increase to 48.4 from 47.8 in February.

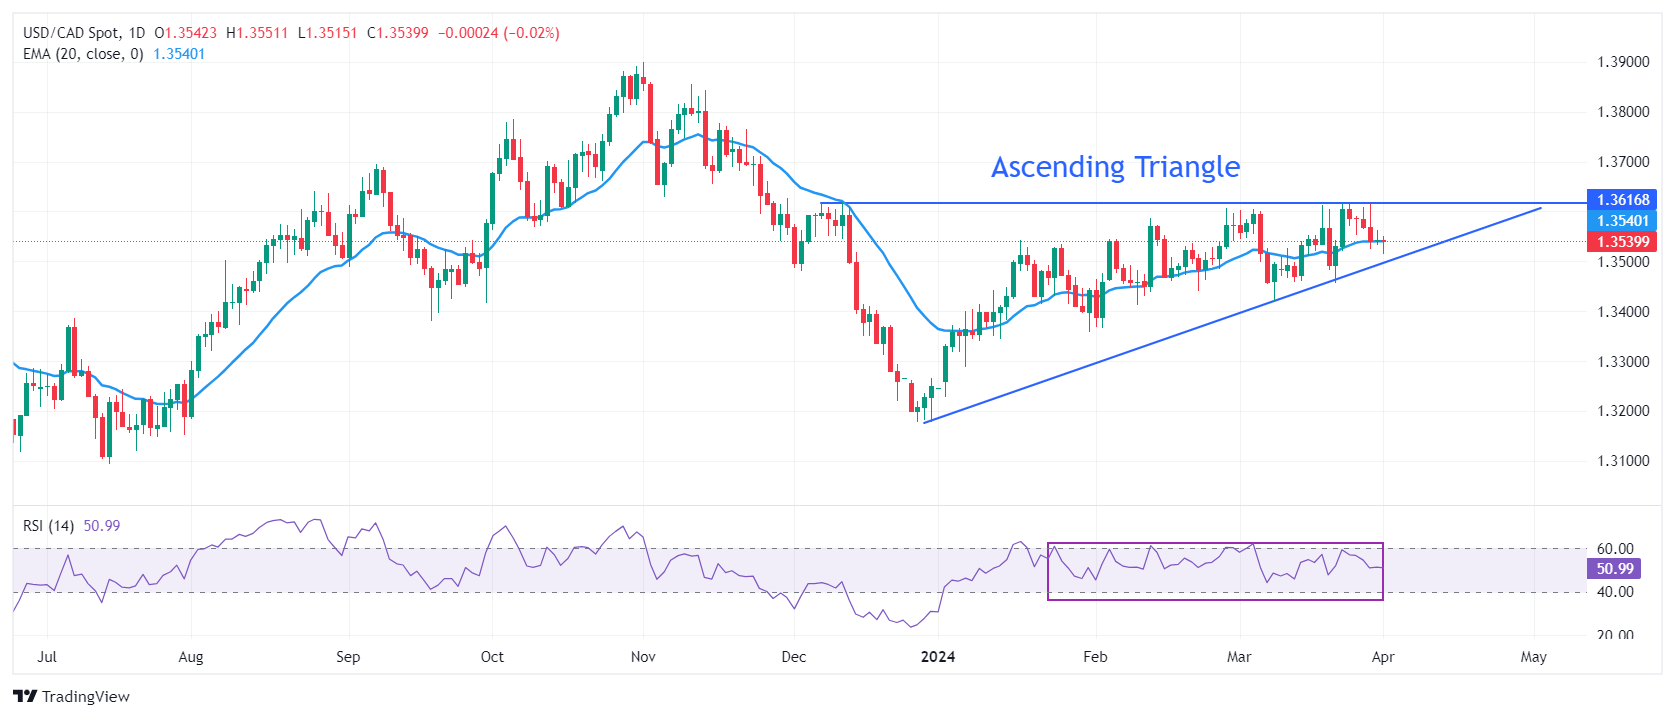
USD/CAD seems close to exploding the Ascending Triangle pattern formed on a daily time. The chart pattern exhibits a sharp volatility contraction. The upward-sloping border of the aforementioned pattern is placed from December 27 low at 1.3177 while horizontal resistance is plotted from December 7 high at 1.3620

The 20-day Exponential Moving Average (EMA) near 1.3520 remains stick to spot prices, indicating a consolidation ahead.

The 14-period Relative Strength Index (RSI) oscillates inside the 40.00-60.00 range, indicating indecisiveness among investors.

The Loonie asset would observe a fresh upside if it breaks above December 7 high at 1.3620. This will drive the asset towards May 26 high at 1.3655, followed by the round-level resistance of 1.3700.

On the flip side, a downside move below February 22 low at 1.3441 would expose the asset to February 9 low at 1.3413. A breakdown below the latter would extend downside towards January 15 low at 1.3382.

USD/CAD daily chart

USD/CAD

Overview
Today last price1.354
Today Daily Change-0.0002
Today Daily Change %-0.01
Today daily open1.3542
 
Trends
Daily SMA201.3536
Daily SMA501.3508
Daily SMA1001.3494
Daily SMA2001.3497
 
Levels
Previous Daily High1.3562
Previous Daily Low1.3532
Previous Weekly High1.3614
Previous Weekly Low1.3525
Previous Monthly High1.3614
Previous Monthly Low1.342
Daily Fibonacci 38.2%1.3551
Daily Fibonacci 61.8%1.3544
Daily Pivot Point S11.3529
Daily Pivot Point S21.3516
Daily Pivot Point S31.35
Daily Pivot Point R11.3559
Daily Pivot Point R21.3575
Daily Pivot Point R31.3588

Author

Sagar Dua

Sagar Dua

FXStreet

Sagar Dua is associated with the financial markets from his college days. Along with pursuing post-graduation in Commerce in 2014, he started his markets training with chart analysis.

More from Sagar Dua
Share:

Editor's Picks

EUR/USD flirts with daily highs, retargets 1.1900

EUR/USD regains upside traction, returning to the 1.1880 zone and refocusing its attention to the key 1.1900 barrier. The pair’s slight gains comes against the backdrop of a humble decline in the US Dollar as investors continue to assess the latest US CPI readings and the potential Fed’s rate path.

GBP/USD remains well bid around 1.3650

GBP/USD maintains its upside momentum in place, hovering around daily highs near 1.3650 and setting aside part of the recent three-day drop. Cable’s improved sentiment comes on the back of the Greenback’s  irresolute price action, while recent hawkish comments from the BoE’s Pill also collaborate with the uptick.

Gold clings to gains just above $5,000/oz

Gold is reclaiming part of the ground lost on Wednesday’s marked decline, as bargain-hunters keep piling up and lifting prices past the key $5,000 per troy ounce. The precious metal’s move higher is also underpinned by the slight pullback in the US Dollar and declining US Treasury yields across the curve.

Crypto Today: Bitcoin, Ethereum, XRP in choppy price action, weighed down by falling institutional interest 

Bitcoin's upside remains largely constrained amid weak technicals and declining institutional interest. Ethereum trades sideways above $1,900 support with the upside capped below $2,000 amid ETF outflows.

Week ahead – Data blitz, Fed Minutes and RBNZ decision in the spotlight

US GDP and PCE inflation are main highlights, plus the Fed minutes. UK and Japan have busy calendars too with focus on CPI. Flash PMIs for February will also be doing the rounds. RBNZ meets, is unlikely to follow RBA’s hawkish path.

Ripple Price Forecast: XRP potential bottom could be in sight

Ripple edges up above the intraday low of $1.35 at the time of writing on Friday amid mixed price actions across the crypto market. The remittance token failed to hold support at $1.40 the previous day, reflecting risk-off sentiment amid a decline in retail and institutional sentiment.